Page 211Menu
CHOICES AND STRATEGIES: Choosing the Appropriate Kind of Graphic
CHOICES AND STRATEGIES: Choosing the Appropriate Kind of Graphic
| IF YOU WANT TO . . . | TRY THIS TYPE OF GRAPHIC | WHAT THIS GRAPHIC DOES BEST |
| Illustrate numerical information | 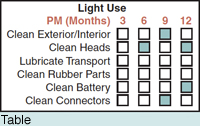
|
Shows large amounts of numerical data, especially useful when there are several variables for a number of items |
|
Shows the relative values of two or more items. | |

Source: Whitehouse.gov, 2014: http:/
|
Enlivens statistical information for the general reader. | |
|
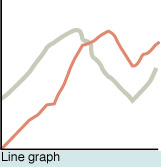
Shows how the quantity of an item changes over time. A line graph can present much more data than a bar graph can. | |
|
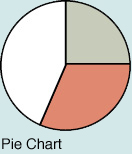
Shows the relative sizes of the parts of a whole. Pie charts are instantly familiar to most readers. | |
| Illustrate logical relationships | 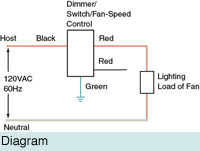
|
Represents relationships among items or properties of items. |
|
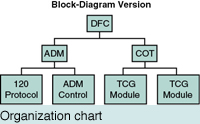
Shows the lines of authority and responsibility in an organization or hierarchical relationships among items. | |
|
Page 212
Illustrate process descriptions and instructions
|

|
Lists or shows what equipment or materials to gather or describes an action. |
| Illustrate process descriptions and instructions | 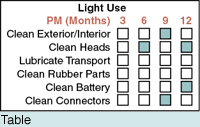
|
Shows numbers of items or indicates the state (on/off) of an item. |
|
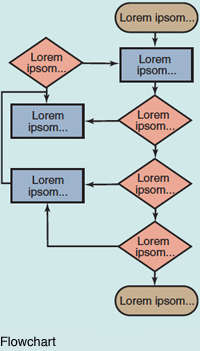
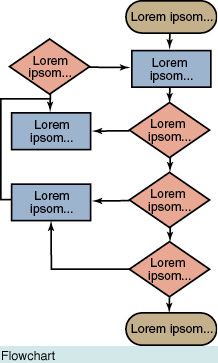
Shows the stages of a procedure or a process. | |
|
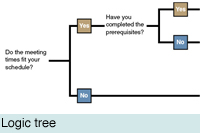
Shows which of two or more paths to follow. | |
| Illustrate visual and spatial characteristics | 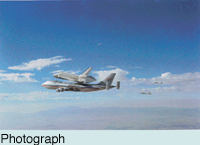
|
Shows precisely the external surface of objects. |
|
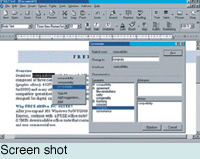
Shows what appears on a computer screen. | |
|
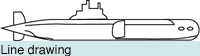
Shows simplified representations of objects. | |
|
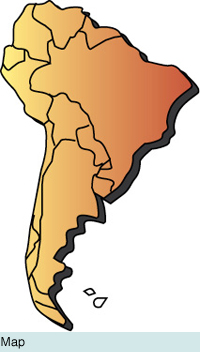
Shows geographic areas. |
Based on W. Horton, “The Almost Universal Language: Graphics for International Documentation” from TECHNICAL COMMUNICATION 40 (1993): 682–693.
[Leave] [Close]