6.2
Statistical Analysis of Sequence Alignments Can Detect Homology
A significant sequence similarity between two molecules implies that they are likely to have the same evolutionary origin and, therefore, similar three-dimensional structures, functions, and mechanisms. Both nucleic acid and protein sequences can be compared to detect homology. However, the possibility exists that the observed agreement between any two sequences is solely a product of chance. Because nucleic acids are composed of fewer building blocks than proteins (4 bases versus 20 amino acids), the likelihood of random agreement between two DNA or RNA sequences is significantly greater than that for protein sequences. For this reason, detection of homology between protein sequences is typically far more effective.
To illustrate sequence-comparison methods, let us consider a class of proteins called the globins. Myoglobin is a protein that binds oxygen in muscle, whereas hemoglobin is the oxygen-carrying protein in blood (Chapter 7). Both proteins cradle a heme group, an iron-containing organic molecule that binds the oxygen. Each human hemoglobin molecule is composed of four heme-containing polypeptide chains, two identical α chains and two identical β chains. Here, we shall consider only the α chain. To examine the similarity between the amino acid sequence of the human α chain and that of human myoglobin (Figure 6.4), we apply a method, referred to as a sequence alignment, in which the two sequences are systematically aligned with respect to each other to identify regions of significant overlap.
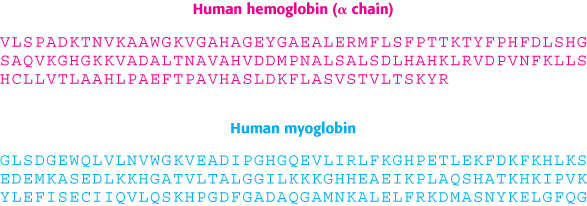
FIGURE 6.4Amino acid sequences of human hemoglobin (α chain) and human myoglobin. α-Hemoglobin is composed of 141 amino acids; myoglobin consists of 153 amino acids. (One-letter abbreviations designating amino acids are used; see Table 2.2.)
How can we tell where to align the two sequences? In the course of evolution, the sequences of two proteins that have an ancestor in common will have diverged in a variety of ways. Insertions and deletions may have occurred at the ends of the proteins or within the functional domains themselves. Individual amino acids may have been mutated to other residues of varying degrees of similarity. To understand how the methods of sequence alignment take these potential sequence variations into account, let us first consider the simplest approach, where we slide one sequence past the other, one amino acid at a time, and count the number of matched residues, or sequence identities (Figure 6.5). For α-hemoglobin and myoglobin, the best alignment reveals 23 sequence identities, spread throughout the central parts of the sequences.
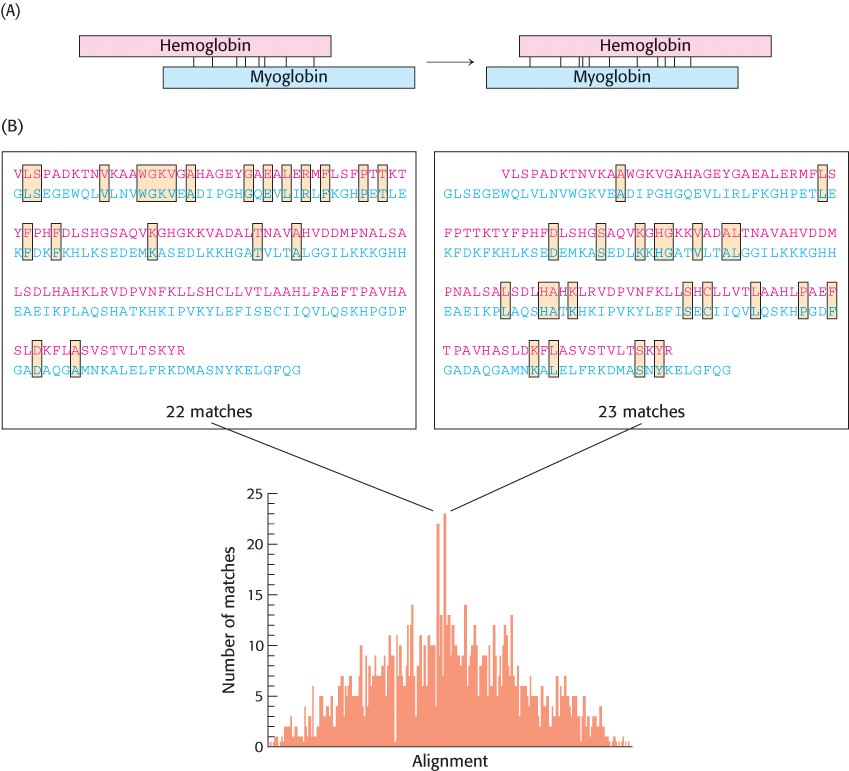
FIGURE 6.5Comparing the amino acid sequences of α-hemoglobin and myoglobin. (A) A comparison is made by sliding the sequences of the two proteins past each other, one amino acid at a time, and counting the number of amino acid identities between the proteins. (B) The two alignments with the largest number of matches are shown above the graph, which plots the matches as a function of alignment.
However, careful examination of all the possible alignments and their scores suggests that important information regarding the relationship between myoglobin and hemoglobin α has been lost with this method. In particular, we see that another alignment, featuring 22 identities, is nearly as good. This alignment is shifted by six residues relative to the preceding alignment and yields identities that are concentrated toward the amino-terminal end of the sequences. By introducing a gap into one of the sequences, the identities found in both alignments will be represented (Figure 6.6). Insertion of gaps allows the alignment method to compensate for the insertions or deletions of nucleotides that may have taken place in the gene for one molecule but not the other in the course of evolution.
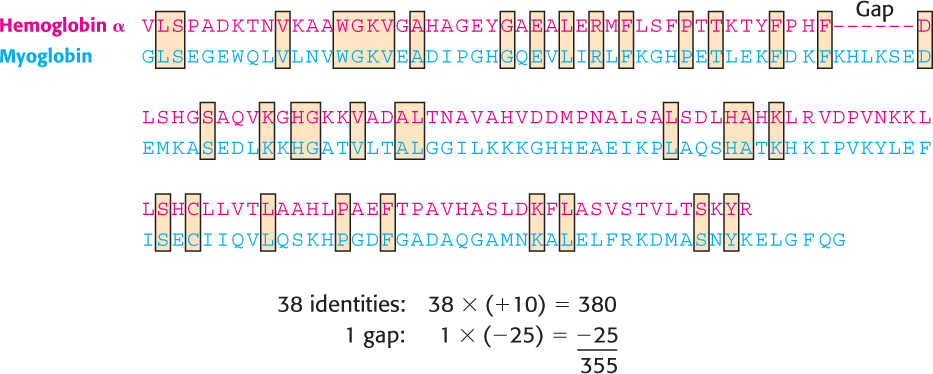
FIGURE 6.6Alignment with gap insertion. The alignment of α-hemoglobin and myoglobin after a gap has been inserted into the hemoglobin α sequence.
The use of gaps substantially increases the complexity of sequence alignment because a vast number of possible gaps, varying in both position and length, must be considered throughout each sequence. Moreover, the introduction of an excessive number of gaps can yield an artificially high number of identities. Nevertheless, methods have been developed for the insertion of gaps in the automatic alignment of sequences. These methods use scoring systems to compare different alignments, including penalties for gaps to prevent the insertion of an unreasonable number of them. For example, in one scoring system, each identity between aligned sequences is counted as +10 points, whereas each gap introduced, regardless of size, counts for −25 points. For the alignment shown in Figure 6.6, there are 38 identities (38 × 10 = 380) and 1 gap (1 × −25 = −25), producing a score of (380 + −25 = 355). Overall, there are 38 matched amino acids in an average length of 147 residues; thus, the sequences are 25.9% identical. Next, we must determine the significance of this score and level of identity.
The statistical significance of alignments can be estimated by shuffling
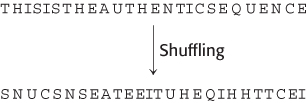
FIGURE 6.7The generation of a shuffled sequence.
The similarities in sequence in Figure 6.5 appear striking, yet there remains the possibility that a grouping of sequence identities has occurred by chance alone. Because proteins are composed of the same set of 20 amino acid monomers, the alignment of any two unrelated proteins will yield some identities, particularly if we allow the introduction of gaps. Even if two proteins have identical amino acid composition, they may not be linked by evolution. It is the order of the residues within their sequences that implies a relationship between them. Hence, we can assess the significance of our alignment by “shuffling,” or randomly rearranging, one of the sequences (Figure 6.7), repeating the sequence alignment, and determining a new alignment score. This process is repeated many times to yield a histogram showing, for each possible score, the number of shuffled sequences that received that score (Figure 6.8). If the original score is not appreciably different from the scores from the shuffled alignments, then we cannot exclude the possibility that the original alignment is merely a consequence of chance.
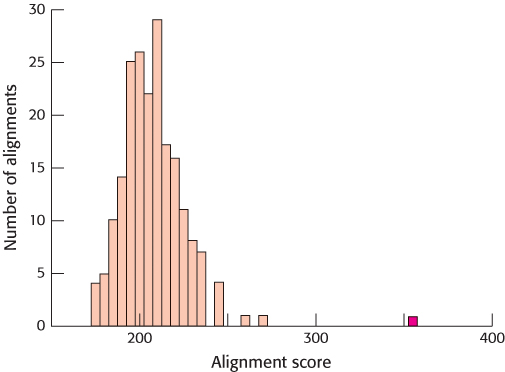
FIGURE 6.8Statistical comparison of alignment scores. Alignment scores are calculated for many shuffled sequences, and the number of sequences generating a particular score is plotted against the score. The resulting plot is a distribution of alignment scores occurring by chance. The alignment score for unshuffled α-hemoglobin and myoglobin (shown in red) is substantially greater than any of these scores, strongly suggesting that the sequence similarity is significant.
When this procedure is applied to the sequences of myoglobin and α-hemoglobin, the authentic alignment (indicated by the red bar in Figure 6.8) clearly stands out. Its score is far above the mean for the alignment scores based on shuffled sequences. The probability that such a deviation occurred by chance alone is approximately 1 in 1020. Thus, we can comfortably conclude that the two sequences are genuinely similar; the simplest explanation for this similarity is that these sequences are homologous—that is, the two molecules have descended from a common ancestor.
Distant evolutionary relationships can be detected through the use of substitution matrices
The scoring scheme heretofore described assigns points only to positions occupied by identical amino acids in the two sequences being compared. No credit is given for any pairing that is not an identity. However, as already discussed, two proteins related by evolution undergo amino acid substitutions as they diverge. A scoring system based solely on amino acid identity cannot account for these changes. To add greater sensitivity to the detection of evolutionary relationships, methods have been developed to compare two amino acids and assess their degree of similarity.
Not all substitutions are equivalent. For example, amino acid changes can be classified as structurally conservative or nonconservative. A conservative substitution replaces one amino acid with another that is similar in size and chemical properties. Conservative substitutions may have only minor effects on protein structure and often can be tolerated without compromising protein function. In contrast, in a nonconservative substitution, an amino acid is replaced by one that is structurally dissimilar. Amino acid changes can also be classified by the fewest number of nucleotide changes necessary to achieve the corresponding amino acid change. Some substitutions arise from the replacement of only a single nucleotide in the gene sequence; whereas others require two or three replacements. Conservative and single-nucleotide substitutions are likely to be more common than are substitutions with more radical effects.
How can we account for the type of substitution when comparing sequences? We can approach this problem by first examining the substitutions that have been observed in proteins known to be evolutionarily related. From an examination of appropriately aligned sequences, substitution matrices have been deduced. A substitution matrix describes a scoring system for the replacement of any amino acid with each of the other 19 amino acids. In these matrices, a large positive score corresponds to a substitution that occurs relatively frequently, whereas a large negative score corresponds to a substitution that occurs only rarely. A commonly used substitution matrix, the Blosum-62 (for Blocks of amino acid substitution matrix), is illustrated in Figure 6.9. In this depiction, each column in this matrix represents one of the 20 amino acids, whereas the position of the single-letter codes within each column specifies the score for the corresponding substitution. Notice that scores corresponding to identity (the boxed codes at the top of each column) are not the same for each residue, owing to the fact that less frequently occurring amino acids such as cysteine (C) and tryptophan (W) will align by chance less often than the more common residues. Furthermore, structurally conservative substitutions such as lysine (K) for arginine (R) and isoleucine (I) for valine (V) have relatively high scores, whereas nonconservative substitutions such as lysine for tryptophan result in negative scores (Figure 6.10). When two sequences are compared, each pair of aligned residues is assigned a score based on the matrix. In addition, gap penalties are often assessed. For example, the introduction of a single-residue gap lowers the alignment score by 12 points and the extension of an existing gap costs 2 points per residue. With the use of this scoring system, the alignment shown in Figure 6.6 receives a score of 115. In many regions, most substitutions are conservative (defined as those substitutions with scores greater than 0) and relatively few are strongly disfavored (Figure 6.11).
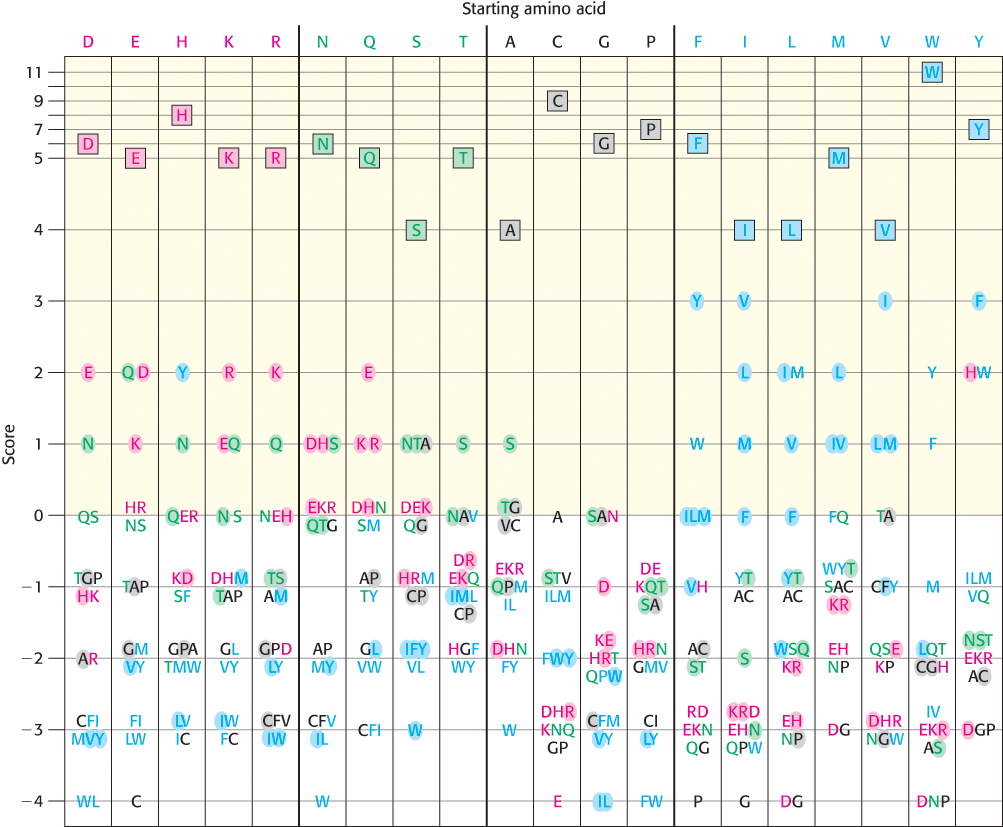
FIGURE 6.9A graphic view of the Blosum-62. This substitution matrix was derived by examining substitutions within aligned sequence blocks in related proteins. Amino acids are classified into four groups (charged, red; polar, green; large and hydrophobic, blue; other, black). Substitutions that require the change of only a single nucleotide are shaded. Identities are boxed. To find the score for a substitution of, for instance, a Y for an H, you find the Y in the column having H at the top and check the number at the left. In this case, the resulting score is 2.
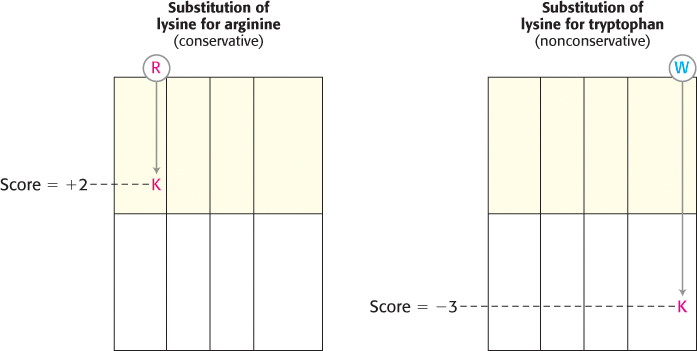
FIGURE 6.10Scoring of conservative and nonconservative substitutions. The Blosum-62 indicates that a conservative substitution (lysine for arginine) receives a positive score, whereas a nonconservative substitution (lysine for tryptophan) is scored negatively. The matrix is depicted as an abbreviated form of Figure 6.9.
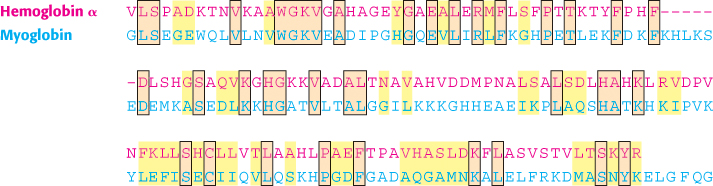
FIGURE 6.11Alignment with conservative substitutions noted. The alignment of α-hemoglobin and myoglobin with conservative substitutions indicated by yellow shading and identities by orange.
This scoring system detects homology between less obviously related sequences with greater sensitivity than would a comparison of identities only. Consider, for example, the protein leghemoglobin, an oxygen-binding protein found in the roots of some plants. The amino acid sequence of leghemoglobin from the herb lupine can be aligned with that of human myoglobin and scored by using either the simple scoring scheme based on identities only or the Blosum-62 (Figure 6.9). Repeated shuffling and scoring provides a distribution of alignment scores (Figure 6.12). Scoring based solely on identities indicates that the probability of the alignment between myoglobin and leghemoglobin occurring by chance alone is 1 in 20. Thus, although the level of similarity suggests a relationship, there is a 5% chance that the similarity is accidental on the basis of this analysis. In contrast, users of the substitution matrix are able to incorporate the effects of conservative substitutions. From such an analysis, the odds of the alignment occurring by chance are calculated to be approximately 1 in 300. Thus, an analysis performed with the substitution matrix reaches a much firmer conclusion about the evolutionary relationship between these proteins (Figure 6.13).
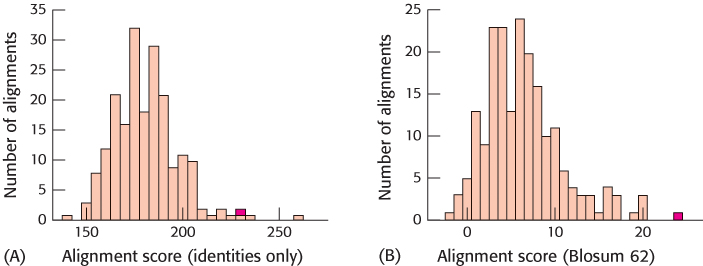
FIGURE 6.12Alignment of identities only versus the Blosum-62. Repeated shuffling and scoring reveal the significance of sequence alignment for human myoglobin versus lupine leghemoglobin with the use of either (A) the simple, identity-based scoring system or (B) the Blosum-62. The scores for the alignment of the authentic sequences are shown in red. Accounting for amino acid similarity in addition to identity reveals a greater separation between the authentic alignment and the population of shuffled alignments.
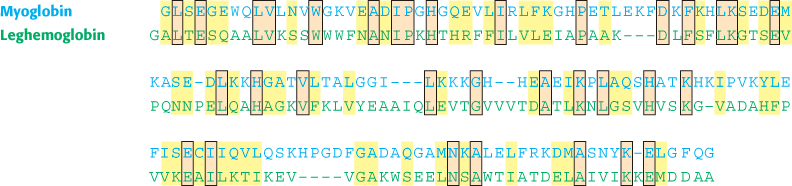
FIGURE 6.13Alignment of human myoglobin and lupine leghemoglobin. The use of Blosum-62 yields the alignment shown between human myoglobin and lupine leghemoglobin, illustrating identities (orange boxes) and conservative substitutions (yellow). These sequences are 23% identical.
Experience with sequence analysis has led to the development of simpler rules of thumb. For sequences longer than 100 amino acids, sequence identities greater than 25% are almost certainly not the result of chance alone; such sequences are probably homologous. In contrast, if two sequences are less than 15% identical, their alignment alone is unlikely to indicate statistically significant similarity. For sequences that are between 15 and 25% identical, further analysis is necessary to determine the statistical significance of the alignment. It must be emphasized that the lack of a statistically significant degree of sequence similarity does not rule out homology. The sequences of many proteins that have descended from common ancestors have diverged to such an extent that the relationship between the proteins can no longer be detected from their sequences alone. As we will see, such homologous proteins can often be detected by examining three-dimensional structures.
Databases can be searched to identify homologous sequences
When the sequence of a protein is first determined, comparing it with all previously characterized sequences can be a source of tremendous insight into its evolutionary relatives and, hence, its structure and function. Indeed, an extensive sequence comparison is almost always the first analysis performed on a newly elucidated sequence. The sequence-alignment methods just described are used to compare an individual sequence with all members of a database of known sequences.
Database searches for homologous sequences are most often accomplished by using resources available on the Internet at the National Center for Biotechnology Information (www.ncbi.nlm.nih.gov/). The procedure used is referred to as a BLAST (Basic Local Alignment Search Tool) search. An amino acid sequence is typed or pasted into the Web browser, and a search is performed, most often against a nonredundant database of all known sequences. At the end of 2013, this database included more than 35 million sequences. A BLAST search yields a list of sequence alignments, each accompanied by an estimate giving the likelihood that the alignment occurred by chance (Figure 6.14).
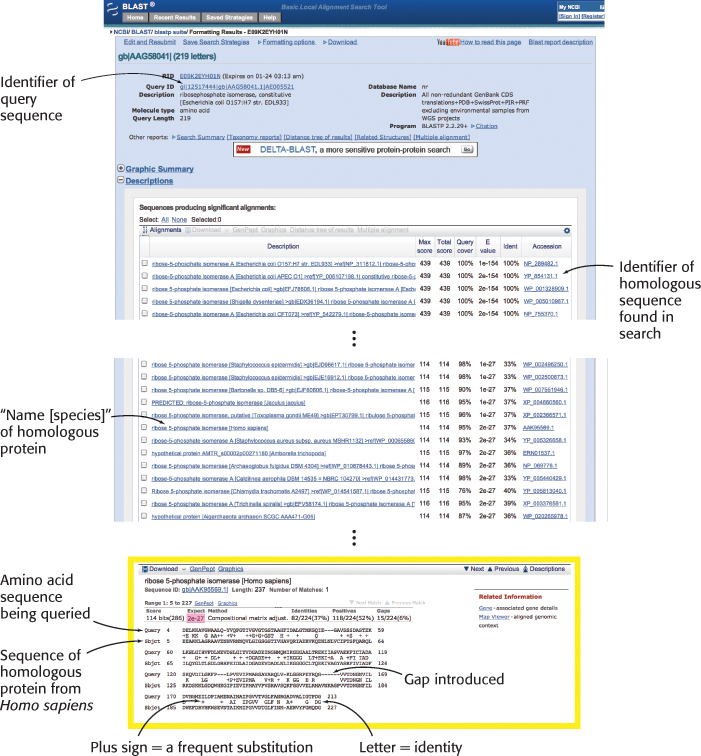
FIGURE 6.14BLAST search results. Part of the results from a BLAST search of the nonredundant (nr) protein sequence database using the sequence of ribose 5-phosphate isomerase (also called phosphopentose isomerase, Chapter 20) from E. coli as a query. Among the thousands of sequences found is the orthologous sequence from humans, and the alignment between these sequences is shown (highlighted in yellow). The number of sequences with this level of similarity expected to be in the database by chance is 2 × 10⁻²⁷ as shown by the E value (highlighted in red). Because this value is much less than 1, the observed sequence alignment is highly significant.
In 1995, investigators reported the first complete sequence of the genome of a free-living organism, the bacterium Haemophilus influenzae. With the sequences available, they performed a BLAST search with each deduced protein sequence. Of 1743 identified protein-coding regions, also called open reading frames (ORFs), 1007 (58%) could be linked to some protein of known function that had been previously characterized in another organism. An additional 347 ORFs could be linked to sequences in the database for which no function had yet been assigned (“hypothetical proteins”). The remaining 389 sequences did not match any sequence present in the database at that time. Thus, investigators were able to identify likely functions for more than half the proteins within this organism solely by sequence comparisons.