Action potentials are mediated by transient changes in Na+ and K+ permeability
One of the most important manifestations of ion-channel action is the nerve impulse, which is the fundamental means of communication in the nervous system. A nerve impulse is an electrical signal produced by the flow of ions across the plasma membrane of a neuron. The interior of a neuron, like that of most other cells, contains a high concentration of K+ and a low concentration of Na+. These ionic gradients are generated by the Na+–K+ ATPase. The cell membrane has an electrical potential determined by the ratio of the internal to the external concentration of ions. In the resting state, the membrane potential is typically −60 mV. A nerve impulse, or action potential, is generated when the membrane potential is depolarized beyond a critical threshold value (e.g., from −60 to −40 mV). The membrane potential becomes positive within about a millisecond and attains a value of about +30 mV before turning negative again (repolarization). This amplified depolarization is propagated along the nerve terminal (Figure 13.13).
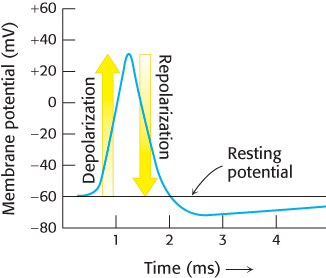
FIGURE 13.13Action potential. Signals are sent along neurons by the transient depolarization and repolarization of the membrane.
Ingenious experiments carried out by Alan Hodgkin and Andrew Huxley revealed that action potentials arise from large, transient changes in the permeability of the axon membrane to Na+ and K+ ions. Depolarization of the membrane beyond the threshold level leads to an increase in permeability to Na+. Sodium ions begin to flow into the cell because of the large electrochemical gradient across the plasma membrane. The entry of Na+ further depolarizes the membrane, leading to a further increase in Na+ permeability. This positive feedback yields the very rapid and large change in membrane potential described above and shown in Figure 13.13.
The membrane spontaneously becomes less permeable to Na+ and more permeable to K+. Consequently, K+ flows outward, and so the membrane potential returns to a negative value. The resting level of −60 mV is restored in a few milliseconds as the K+ conductance decreases to the value characteristic of the unstimulated state. The wave of depolarization followed by repolarization moves rapidly along a nerve cell. The propagation of these waves allows a touch at the tip of your toe to be detected in your brain in a few milliseconds.
This model for the action potential postulated the existence of ion channels specific for Na+ and K+. These channels must open in response to changes in membrane potential and then close after having remained open for a brief period of time. This bold hypothesis predicted the existence of molecules with a well-defined set of properties long before tools existed for their direct detection and characterization.
Patch-clamp conductance measurements reveal the activities of single channels
Direct evidence for the existence of these channels was provided by the patch-clamp technique, which was introduced by Erwin Neher and Bert Sakmann in 1976. This powerful technique enables the measurement of the ion conductance through a small patch of cell membrane. In this technique, a clean glass pipette with a tip diameter of about 1 μm is pressed against an intact cell to form a seal (Figure 13.14). Slight suction leads to the formation of a very tight seal so that the resistance between the inside of the pipette and the bathing solution is many gigaohms (1 gigaohm is equal to 109 ohms). Thus, a gigaohm seal (called a gigaseal) ensures that an electric current flowing through the pipette is identical with the current flowing through the membrane covered by the pipette. The gigaseal makes possible high-resolution current measurements while a known voltage is applied across the membrane. Remarkably, the flow of ions through a single channel and transitions between the open and the closed states of a channel can be monitored with a time resolution of microseconds (Figure 13.15). Furthermore, the activity of a channel in its native membrane environment, even in an intact cell, can be directly observed. Patch-clamp methods provided one of the first views of single biomolecules in action. Subsequently, other methods for observing single molecules were invented, opening new vistas on biochemistry at its most fundamental level.
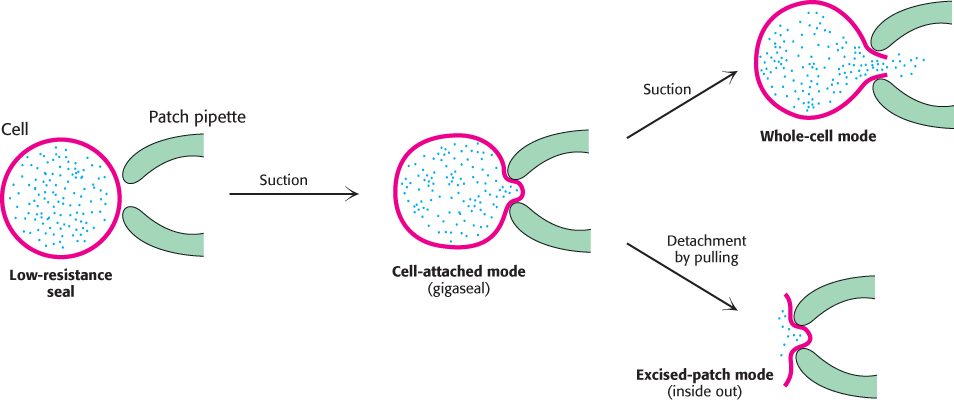
FIGURE 13.14Patch-clamp modes. The patch-clamp technique for monitoring channel activity is highly versatile. A high-resistance seal (gigaseal) is formed between the pipette and a small patch of plasma membrane. This configuration is called cell-attached mode. The breaking of the membrane patch by increased suction produces a low-resistance pathway between the pipette and the interior of the cell. The activity of the channels in the entire plasma membrane can be monitored in this whole-cell mode. To prepare a membrane in the excised-patch mode, the pipette is pulled away from the cell. A piece of plasma membrane with its cytoplasmic side now facing the medium is monitored by the patch pipette.
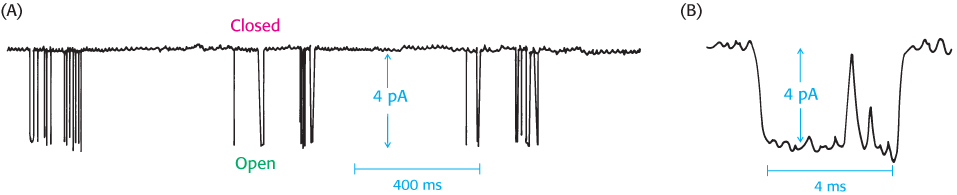
FIGURE 13.15Observing single channels. (A) The results of a patch-clamp experiment revealing the small amount of current, measured in picoamperes (pA, 10−12 amperes) passing through a single ion channel. The downward spikes indicate transitions between closed and open states. (B) Closer inspection of one of the spikes in (A) reveals the length of time the channel is in the open state.
The structure of a potassium ion channel is an archetype for many ion-channel structures
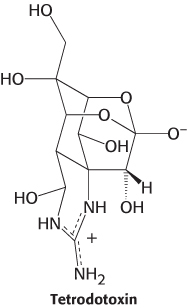
With the existence of ion channels firmly established by patch-clamp methods, scientists sought to identify the molecules that form ion channels. The Na+ channel was first purified from the electric organ of electric eel, which is a rich source of the protein forming this channel. The channel was purified on the basis of its ability to bind tetrodotoxin, a neurotoxin from the puffer fish that binds to Na+ channels very tightly (Ki ≈ 1 nM). The lethal dose of this poison for an adult human being is about 10 ng.
The isolated Na+ channel is a single 260-kDa chain. Cloning and sequencing of cDNAs encoding Na+ channels revealed that the channel contains four internal repeats, each having a similar amino acid sequence, suggesting that gene duplication and divergence have produced the gene for this channel. Hydrophobicity profiles indicate that each repeat contains five hydrophobic segments (S1, S2, S3, S5, and S6). Each repeat also contains a highly positively charged S4 segment; positively charged arginine or lysine residues are present at nearly every third residue. It was proposed that segments S1 through S6 are membrane-spanning α helices, while the positively charged residues in S4 act as the voltage sensors of the channel.
The purification of K+ channels proved to be much more difficult because of their low abundance and the lack of known high-affinity ligands comparable to tetrodotoxin. The breakthrough came in studies of mutant fruit flies that shake violently when anesthetized with ether. The mapping and cloning of the gene, termed shaker, responsible for this defect revealed the amino acid sequence encoded by a K+-channel gene. The shaker gene encodes a 70-kDa protein that contains sequences corresponding to segments S1 through S6 in one of the repeated units of the Na+ channel. Thus, a K+-channel subunit is homologous to one of the repeated units of Na+ channels. Consistent with this homology, four Shaker polypeptides come together to form a functional channel. More recently, bacterial K+ channels were discovered that contain only the two membrane-spanning regions corresponding to segments S5 and S6. This and other information suggested that S5 and S6, including the region between them, form the actual pore in the K+ channel. Segments S1 through S4 contain the apparatus that opens the pore. The sequence relations between these ion channels are summarized in Figure 13.16.
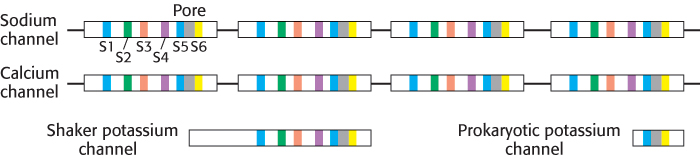
FIGURE 13.16Sequence relations of ion channels. Like colors indicate structurally similar regions of the sodium, calcium, and potassium channels. Each of these channels exhibits approximate fourfold symmetry, either within one chain (sodium, calcium channels) or by forming tetramers (potassium channels).
In 1998, Roderick MacKinnon and coworkers determined the structure of a K+ channel from the bacterium Streptomyces lividans by x-ray crystallography. This channel contains only the pore-forming segments S5 and S6. As expected, the K+ channel is a tetramer of identical subunits, each of which includes two membrane-spanning α helices (Figure 13.17). The four subunits come together to form a pore in the shape of a cone that runs through the center of the structure.

 FIGURE 13.17 Structure of the potassium ion channel. The K+ channel, composed of four identical subunits, is cone shaped, with the larger opening facing the inside of the cell (center). A view down the pore, looking toward the outside of the cell, shows the relations of the individual subunits (left). One of the four identical subunits of the pore is illustrated at the right, with the pore-forming region shown in gray. [Drawn from 1K4C.pdb.]
The structure of the potassium ion channel reveals the basis of ion specificity
The structure presented in Figure 13.17 probably represents the K+ channel in a closed form. Nonetheless, it suggests how the channel is able to exclude all but K+ ions. Beginning from the inside of the cell, the pore starts with a diameter of approximately 10 Å and then constricts to a smaller cavity with a diameter of 8 Å. Both the opening to the outside and the central cavity of the pore are filled with water, and a K+ ion can fit in the pore without losing its shell of bound water molecules. Approximately two-thirds of the way through the membrane, the pore becomes more constricted (3-Å diameter). At that point, any K+ ions must give up their water molecules and interact directly with groups from the protein. The channel structure effectively reduces the thickness of the membrane from 34 Å to 12 Å by allowing the solvated ions to penetrate into the membrane before the ions must directly interact with the channel (Figure 13.18).
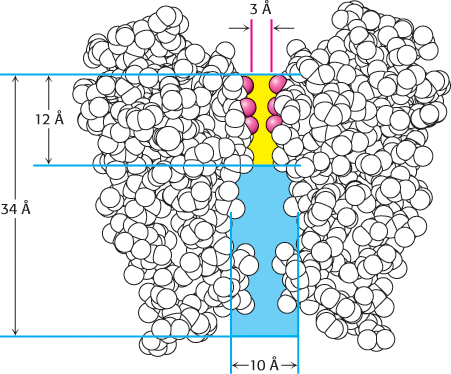
FIGURE 13.18Path through a channel. A potassium ion entering the K+ channel can pass a distance of 22 Å into the membrane while remaining solvated with water (blue). At this point, the pore diameter narrows to 3 Å (yellow), and potassium ions must shed their water and interact with carbonyl groups (red) of the pore amino acids.
For K+ ions to relinquish their water molecules, other polar interactions must replace those with water. The restricted part of the pore is built from residues contributed by the two transmembrane α helices. In particular, a five-amino-acid stretch within this region functions as the selectivity filter that determines the preference for K+ over other ions (Figure 13.19). The stretch has the sequence Thr-Val-Gly-Tyr-Gly (TVGYG), and is nearly completely conserved in all K+ channels. The region of the strand containing the conserved sequence lies in an extended conformation and is oriented such that the peptide carbonyl groups are directed into the channel, in good position to interact with the potassium ions.
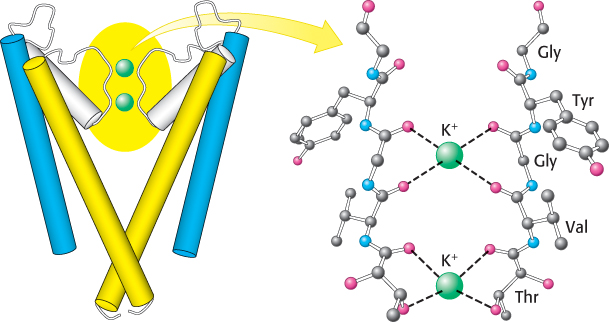
FIGURE 13.19Selectivity filter of the potassium ion channel. Potassium ions interact with the carbonyl groups of the TVGYG sequence of the selectivity filter, located at the 3-Å-diameter pore of the K+ channel. Only two of the four channel subunits are shown.
TABLE 13.1 Properties of alkali cations
|
|
|
Hydration free energy in kJ mol−1 (kcal mol−1) |
|
|
|
|
|
|
|
|
|
|
|
|
|
|
|
|
|
|
|
|
Potassium ion channels are 100-fold more permeable to K+ than to Na+. How is this high degree of selectivity achieved? Ions having a radius larger than 1.5 Å cannot pass into the narrow diameter (3 Å) of the selectivity filter of the K+ channel. However, a bare Na+ is small enough (Table 13.1) to pass through the pore. Indeed, the ionic radius of Na+ is substantially smaller than that of K+. How then is Na+ rejected?
The key point is that the free-energy costs of dehydrating these ions are considerable [Na+, 301 kJ mol−1 (72 kcal mol−1), and K+, 230 kJ mol−1 (55 kcal mol−1)]. The channel pays the cost of dehydrating K+ by providing optimal compensating interactions with the carbonyl oxygen atoms lining the selectivity filter. Careful studies of the potassium channel, enabled by the determination of its three-dimensional structure, have revealed that the interior of the pore is a highly dynamic, fluid environment. The favorable interactions between the carbonyl oxygen atoms, which carry a partial negative charge, with the cation are balanced by the repulsion of these oxygen atoms from one another. For this channel, the ideal balance is achieved with K+, but not with Na+ (Figure 13.20). Hence, sodium ions are rejected because the higher energetic cost of dehydrating them would not be recovered.
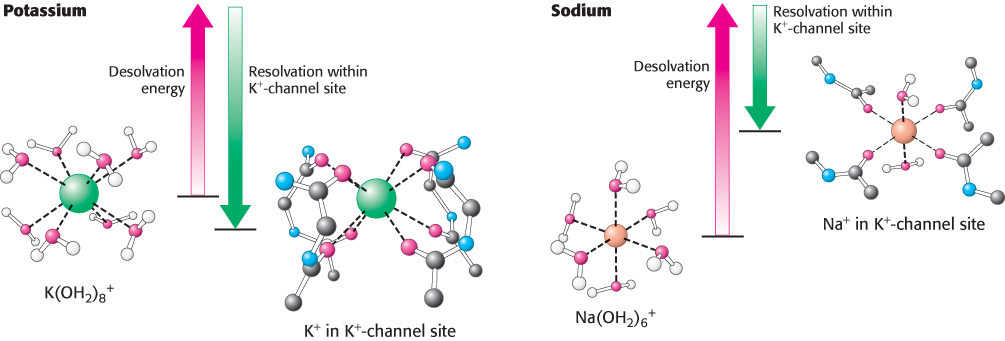
FIGURE 13.20Energetic basis of ion selectivity. The energy cost of dehydrating a potassium ion is compensated by favorable interactions with the selectivity filter. Because a sodium ion is too small to interact favorably with the selectivity filter, the free energy of desolvation cannot be compensated and the sodium ion does not pass through the channel.
 The K+ channel structure enables a clearer understanding of the structure and function of Na+ and Ca2+ channels because of their homology to K+ channels. Sequence comparisons and the results of muta-genesis experiments have implicated the region between segments S5 and S6 in ion selectivity in the Ca2+ channel. In Ca2+ channels, one glutamate residue of this region in each of the four repeated units plays a major role in determining ion selectivity. Residues in the positions corresponding to the glutamate residues in Ca2+ channels are major components of the selectivity filter of the Na+ channel. These residues—aspartate, glutamate, lysine, and alanine—are located in each of the internal repeats of the Na+ channel, forming a region termed the DEKA locus. Thus, the potential fourfold symmetry of the channel is clearly broken in this region, which explains why Na+ channels consist of a single large polypeptide chain rather than a noncovalent assembly of four identical subunits. The preference of the Na+ channel for Na+ over K+ depends on ionic radius; the diameter of the pore determined by these residues and others is sufficiently restricted that small ions such as Na+ and Li+ can pass through the channel, but larger ions such as K+ are significantly hindered.
The structure of the potassium ion channel explains its rapid rate of transport
The tight binding sites required for ion selectivity should slow the progress of ions through a channel, yet ion channels achieve rapid rates of ion transport. How is this paradox resolved? A structural analysis of the K+ channel at high resolution provides an appealing explanation. Four K+-binding sites crucial for rapid ion flow are present in the constricted region of the K+ channel. Consider the process of ion conductance starting from inside the cell (Figure 13.21). A hydrated potassium ion proceeds into the channel and through the relatively unrestricted part of the channel. The ion then gives up its coordinated water molecules and binds to a site within the selectivity-filter region. The ion can move between the four sites within the selectivity filter because they have similar ion affinities. As each subsequent potassium ion moves into the selectivity filter, its positive charge will repel the potassium ion at the nearest site, causing it to shift to a site farther up the channel and in turn push upward any potassium ion already bound to a site farther up. Thus, each ion that binds anew favors the release of an ion from the other side of the channel. This multiple-binding-site mechanism solves the paradox of high ion selectivity and rapid flow.
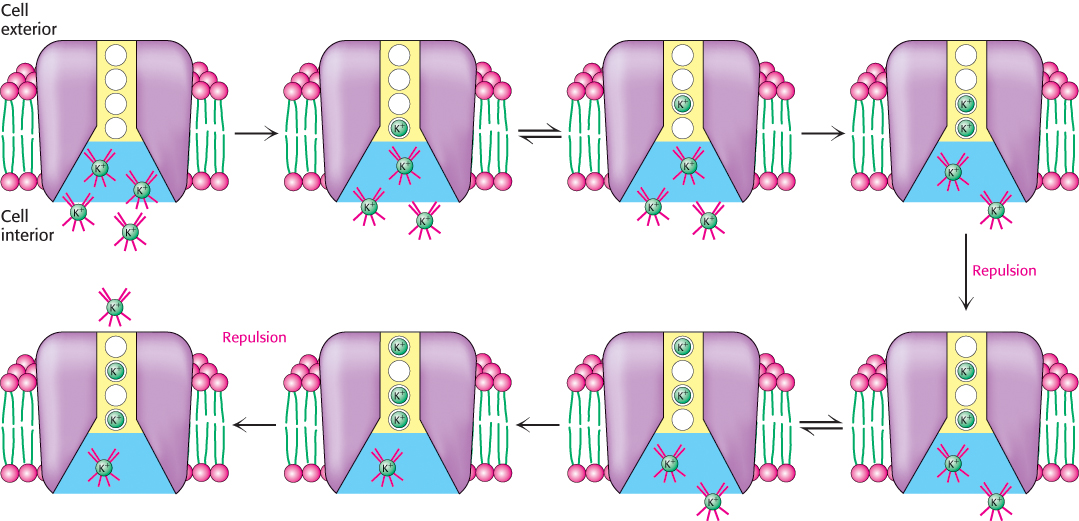
FIGURE 13.21Model for K+-channel ion transport. The selectivity filter has four binding sites. Hydrated potassium ions can enter these sites, one at a time, losing their hydration shells. When two ions occupy adjacent sites, electrostatic repulsion forces them apart. Thus, as ions enter the channel from one side, other ions are pushed out the other side.
Voltage gating requires substantial conformational changes in specific ion-channel domains
Some Na+ and K+ channels are gated by membrane potential; that is, they change conformation to a highly conducting form in response to changes in voltage across the membrane. As already noted, these voltage-gated channels include segments S1 through S4 in addition to the pore itself formed by S5 and S6. The structure of a voltage-gated K+ channel from Aeropyrum pernix has been determined by x-ray crystallography (Figure 13.22). The segments S1 through S4 form domains, termed “paddles,” that extend from the core of the channel. These paddles include the segment S4, the voltage sensor itself. Segment S4 forms an α helix lined with positively charged residues. In contrast with expectations, segments S1 through S4 are not enclosed within the protein but, instead, are positioned to lie in the membrane itself.
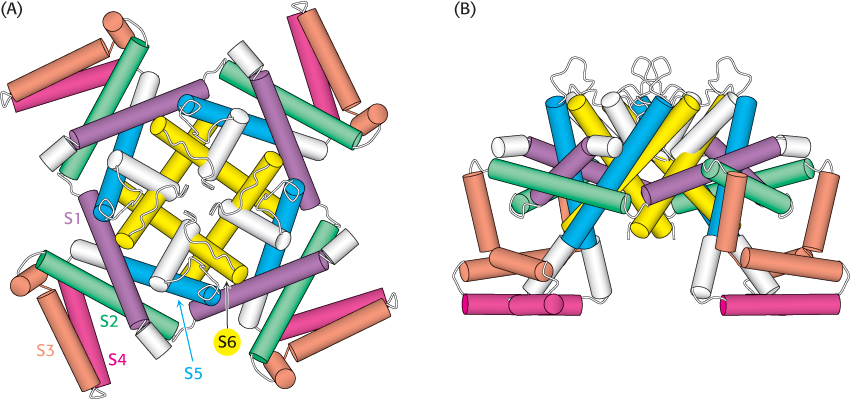
FIGURE 13.22 Structure of a voltage-gated potassium channel. (A) A view looking down through the pore. (B) A side view. Notice that the positively charged S4 region (red) lies on the outside of the structure at the bottom of the pore. [Drawn from 1ORQ.pdb.]
A model for voltage gating has been proposed by Roderick MacKinnon and coworkers on the basis of this structure and a range of other experiments (Figure 13.23). In the closed state, the paddles lie in a “down” position. On membrane depolarization, the cytoplasmic side of the membrane becomes more positively charged, and the paddles are pulled through the membrane into an “up” position. In this position, they pull the four sides of the base on the pore apart, increasing access to the selectivity filter and opening the channel.
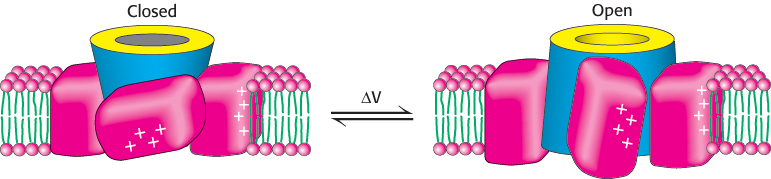
FIGURE 13.23A model for voltage gating of ion channels. The voltage-sensing paddles lie in the “down” position below the closed channel (left). Membrane depolarization pulls these paddles through the membrane. The motion pulls the base of the channel apart, opening the channel (right).
A channel can be inactivated by occlusion of the pore: the ball-and-chain model
The K+ channel and the Na+ channel undergo inactivation within milliseconds of opening (Figure 13.24). A first clue to the mechanism of inactivation came from exposing the cytoplasmic side of either channel to trypsin; cleavage by trypsin produced trimmed channels that stayed persistently open after depolarization. Furthermore, a mutant Shaker channel lacking 42 amino acids near the amino terminus opened in response to depolarization but did not inactivate. Remarkably, inactivation was restored by adding a synthetic peptide corresponding to the first 20 residues of the native channel.
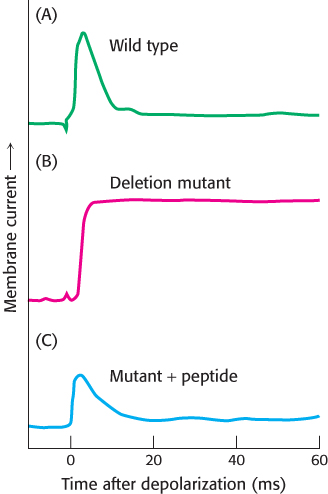
FIGURE 13.24Inactivation of the potassium ion channel. The amino-terminal region of the K+ chain is critical for inactivation. (A) The wild-type Shaker K+ channel displays rapid inactivation after opening. (B) A mutant channel lacking residues 6 through 46 does not inactivate. (C) Inactivation can be restored by adding a peptide consisting of residues 1 through 20 at a concentration of 100 μM. [Data from W. N. Zagotta, T. Hoshi, and R. W. Aldrich, Science 250:568–571, 1990.]
These experiments strongly support the ball-and-chain model for channel inactivation that had been proposed years earlier (Figure 13.25). According to this model, the first 20 residues of the K+ channel form a cytoplasmic unit (the ball) that is attached to a flexible segment of the polypeptide (the chain). When the channel is closed, the ball rotates freely in the aqueous solution. When the channel opens, the ball quickly finds a complementary site in the open pore and occludes it. Hence, the channel opens for only a brief interval before it undergoes inactivation by occlusion. Shortening the chain speeds inactivation because the ball finds its target more quickly. Conversely, lengthening the chain slows inactivation. Thus, the duration of the open state can be controlled by the length and flexibility of the tether. In some senses, the “ball” domains, which include substantial regions of positive charge, can be thought of as large, tethered cations that are pulled into the open channel but get stuck and block further ion conductance.
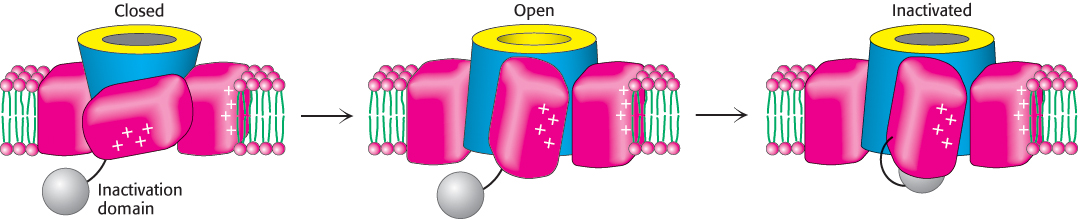
FIGURE 13.25Ball-and-chain model for channel inactivation. The inactivation domain, or “ball” (gray), is tethered to the channel by a flexible “chain.” In the closed state, the ball is located in the cytoplasm. Depolarization opens the channel and creates a binding site for the positively charged ball in the mouth of the pore. Movement of the ball into this site inactivates the channel by occluding it.
The acetylcholine receptor is an archetype for ligand-gated ion channels
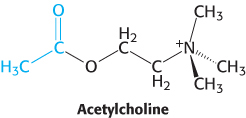
Nerve impulses are communicated across synapses by small, diffusible molecules called neurotransmitters. One neurotransmitter is acetylcholine. The presynaptic membrane of a synapse is separated from the postsynaptic membrane by a gap of about 50 nm called the synaptic cleft. The arrival of a nerve impulse at the end of an axon leads to the synchronous export of the contents of some 300 membrane-bound compartments, or vesicles, of acetylcholine into the cleft (Figure 13.26). The binding of acetylcholine to the postsynaptic membrane markedly changes its ionic permeability, triggering an action potential. Acetylcholine opens a single kind of cation channel, called the acetylcholine receptor, which is almost equally permeable to Na+ and to K+.
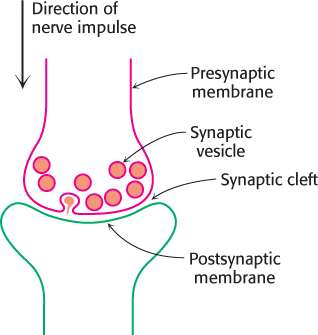
FIGURE 13.26Schematic representation of a synapse.
The acetylcholine receptor is the best-understood ligand-gated channel. This type of channel is gated not by voltage but by the presence of specific ligands. The binding of acetylcholine to the channel is followed by its transient opening. The electric organ of Torpedo marmorata, an electric ray, is a choice source of acetylcholine receptors for study because its electro-plaxes (voltage-generating cells) are very rich in postsynaptic membranes that respond to this neurotransmitter. The receptor is very densely packed in these membranes (∼20,000 μm−2). The acetylcholine receptor of the electric organ has been solubilized by adding a nonionic detergent to a postsynaptic membrane preparation and purified by affinity chromatography on a column bearing covalently attached cobratoxin, a small protein toxin from snakes that has a high affinity for acetylcholine receptors. With the use of techniques presented in Chapter 3, the 268-kDa receptor was identified as a pentamer of four kinds of membrane-spanning subunits—α2, β, γ, and δ—arranged in the form of a ring that creates a pore through the membrane.
The cloning and sequencing of the cDNAs for the four kinds of subunits (50–58 kDa) showed that they have clearly similar sequences; the genes for the α, β, γ, and δ subunits arose by duplication and divergence of a common ancestral gene. Each subunit has a large extracellular domain, followed at the carboxyl end by four predominantly hydrophobic segments that span the bilayer membrane. Acetylcholine binds at the α−γ and α−δ interfaces. Electron microscopic studies of purified acetylcholine receptors demonstrated that the structure has approximate fivefold symmetry, in harmony with the similarity of its five constituent subunits (Figure 13.27).
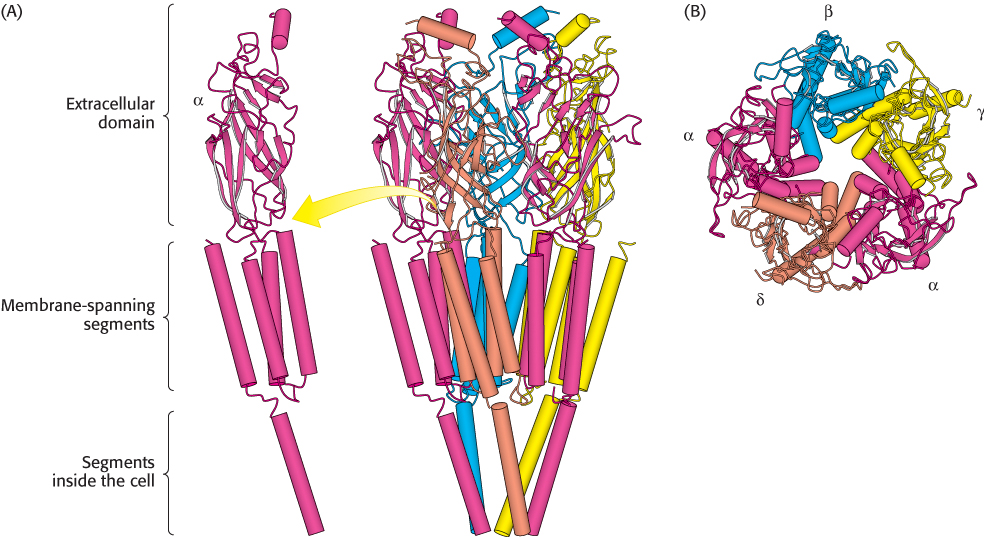
FIGURE 13.27 Structure of the acetylcholine receptor. A model for the structure of the acetylcholine receptor deduced from high-resolution electron microscopic studies reveals that each subunit consists of a large extracellular domain consisting primarily of β strands, four membrane-spanning α helices, and a final α helix inside the cell. (A) A side view shows the pentameric receptor with each subunit type in a different color. One copy of the α subunit is shown in isolation. (B) A view down the channel from outside the cell. [Drawn from 2BG9.pdb.]
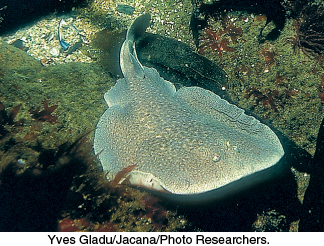
The torpedo (Torpedo marmorata, also known as the electric ray) has an electric organ, rich in acetylcholine receptors, that can deliver a shock of as much as 200 V for approximately 1 s. [Yves Gladu/Jacana/Photo Researchers.]
What is the basis of channel opening? A comparison of the structures of the closed and open forms of the channel would be highly revealing, but such comparisons have been difficult to obtain. Cryoelectron micrographs indicate that the binding of acetylcholine to the extracellular domain causes a structural alteration that initiates rotations of the α-helical rods lining the membrane-spanning pore. The amino acid sequences of these helices point to the presence of alternating ridges of small polar or neutral residues (serine, threonine, glycine) and large nonpolar ones (isoleucine, leucine, phenylalanine). In the closed state, the large residues may occlude the channel by forming a tight hydrophobic ring (Figure 13.28). Indeed, each subunit has a bulky leucine residue at a critical position. The binding of acetylcholine could allosterically rotate the membrane-spanning helices so that the pore would be lined by small polar residues rather than by large hydrophobic ones. The wider, more polar pore would then be open to the passage of Na+ and K+ ions.
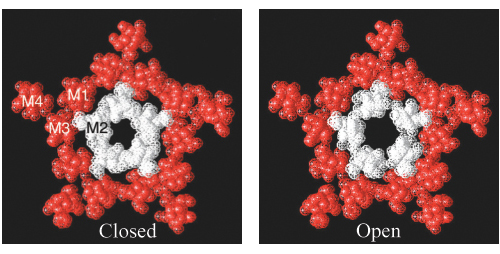
FIGURE 13.28Opening the acetylcholine receptor. Cross sections from electron microscopic reconstructions of the acetylcholine receptor in (left) its closed form and (right) its open form. (The open form corresponds to the structure shown in Figure 13.27). The areas labeled M1, M2, M3, and M4 correspond to the four membrane-spanning α helices of one subunit. The cross section of the open channel was generated by treating the receptor with acetylcholine and freezing the sample within 20 ms. Notice that the hole in the center of the channel is substantially larger in the open structure. The enlargement of the hole is due to the rotation of the M2 helices by approximately 15 degrees along their long axes. [Courtesy of Nigel Unwin.]
Action potentials integrate the activities of several ion channels working in concert
To see how ligand -gated and voltage-gated channels work together to generate a sophisticated physiological response, we now revisit the action potential introduced at the beginning of this section. First, we need to introduce the concept of equilibrium potential. Suppose that a membrane separates two solutions that contain different concentrations of some cation X+, as well as an equivalent amount of anions to balance the charge in each solution (Figure 13.29). Let [X+]in be the concentration of X+ on one side of the membrane (corresponding to the inside of a cell) and [X+]out be the concentration of X+ on the other side (corresponding to the outside of a cell). Suppose that an ion channel opens that allows X+ to move across the membrane. What will happen? It seems clear that X+ will move through the channel from the side with the higher concentration to the side with the lower concentration. However, positive charges will start to accumulate on the side with the lower concentration, making it more difficult to move each additional positively charged ion. An equilibrium will be achieved when the driving force due to the concentration gradient is balanced by the electrostatic force resisting the motion of an additional charge. In these circumstances, the membrane potential is given by the Nernst equation:
Veq = −(RT/zF) ln([X]in/[X]out)
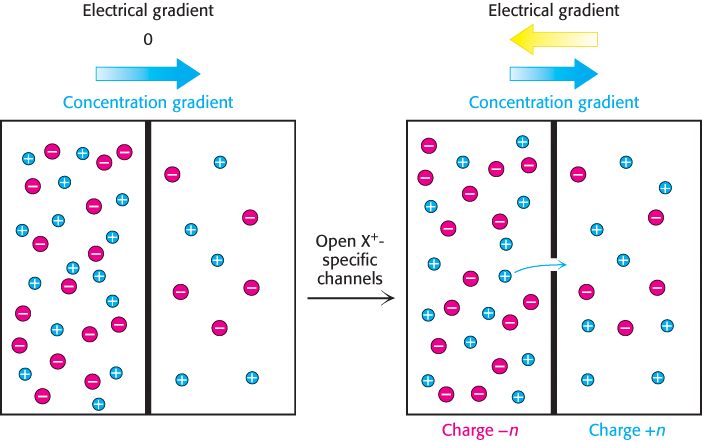
FIGURE 13.29Equilibrium potential. The membrane potential reaches equilibrium when the driving force due to the concentration gradient is exactly balanced by the opposing force due to the repulsion of like charges.
where R is the gas constant and F is the Faraday constant (96.5 kJ V−1 mol−1, or 23.1 kcal V−1 mol−1) and z is the charge on the ion X (e.g., +1 for X+).
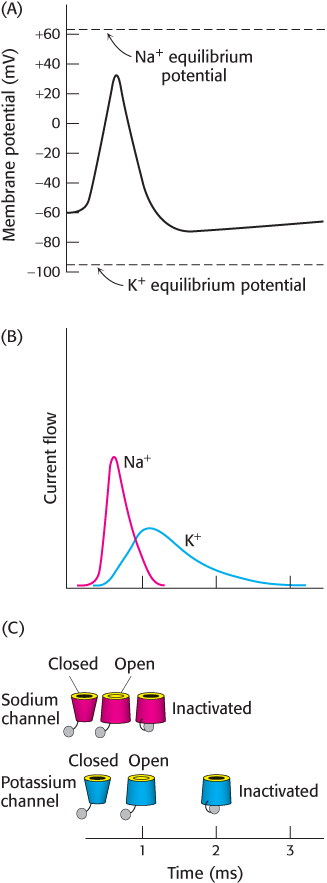
FIGURE 13.30Action-potential mechanism. (A) On the initiation of an action potential, the membrane potential moves from the resting potential upward toward the Na+ equilibrium potential and then downward toward the K+ equilibrium potential. (B) The currents through the Na+ and K+ channels underlying the action potential. (C) The states of the Na+ and K+ channels during the action potential.
The membrane potential at equilibrium is called the equilibrium potential for a given ion at a given concentration ratio across a membrane. For sodium with [Na+]in = 14 mM and [Na+]out = 143 mM, the equilibrium potential is + 62 mV at 37°C. Similarly, for potassium with [K+]in = 157 mM and [K+]out = 4 mM, the equilibrium potential is −98 mV. In the absence of stimulation, the resting potential for a typical neuron is −60 mV. This value is close to the equilibrium potential for K+ owing to the fact that a small number of K+ channels are open.
We are now prepared to consider what happens in the generation of an action potential (Figure 13.30). Initially, a neurotransmitter such as acetylcholine is released into the synaptic cleft from a presynaptic membrane (Figure 13.26). The released acetylcholine binds to the acetylcholine receptor on the postsynaptic membrane, causing it to open within less than a millisecond. The acetylcholine receptor is a nonspecific cation channel. Sodium ions flow into the cell and potassium ions flow out of the cell. Without any further events, the membrane potential would move to a value corresponding to the average of the equilibrium potentials for Na+ and K+, approximately −20 mV. However, as the membrane potential approaches −40 mV, the voltage- sensing paddles of Na+ channels are pulled into the membrane, opening the Na+ channels. With these channels open, sodium ions flow rapidly into the cell and the membrane potential rises rapidly toward the Na+ equilibrium potential (Figure 13.30B, red curve). The voltage-sensing paddles of K+ channels also are pulled into the membrane by the changed membrane potential, but more slowly than Na+ channel paddles. Nonetheless, after approximately 1 ms, many K+ channels start to open. At the same time, inactivation “ball” domains plug the open Na+ channels, decreasing the Na+ current. The acetylcholine receptors that initiated these events are also inactivated on this time scale. With the Na+ channels inactivated and only the K+ channels open, the membrane potential drops rapidly toward the K+ equilibrium potential (Figure 13.30B, blue curve). The open K+ channels are susceptible to inactivation by their “ball” domains, and these K+ currents, too, are blocked. With the membrane potential returned to close to its initial value, the inactivation domains are released and the channels return to their original closed states. These events propagate along the neuron as the depolarization of the membrane opens channels in nearby patches of membrane.
How much current actually flows across the membrane over the course of an action potential? This question can be addressed from two complementary directions. First, a typical nerve cell contains 100 Na+ channels per square micrometer. At a membrane potential of +20 mV, each channel conducts 107 ions per second. Thus, in a period of 1 millisecond, approximately 105 ions flow through each square micrometer of membrane surface. Assuming a cell volume of 104 μm3 and a surface area of 104 μm2, this rate of ion flow corresponds to an increase in the Na+ concentration of less than 1%. How can this be? A robust action potential is generated because the membrane potential is very sensitive to even a slight change in the distribution of charge. This sensitivity makes the action potential a very efficient means of signaling over long distances and with rapid repetition rates.
Disruption of ion channels by mutations or chemicals can be potentially life-threatening
 The generation of an action potential requires the precise coordination of gating events of a collection of ion channels. Perturbation of this timing can have devastating effects. For example, the rhythmic generation of action potentials by the heart is absolutely essential to maintain delivery of oxygenated blood to the peripheral tissues. Long QT syndrome (LQTS) is a genetic disorder in which the recovery of the action potential from its peak potential to the resting equilibrium potential is delayed. The term “QT” refers to a specific feature of the cardiac electrical activity pattern as measured by electrocardiography. LQTS can lead to brief losses of consciousness (syncope), disruption of normal cardiac rhythm (arrhythmia), and sudden death. The most common mutations identified in LQTS patients inactivate K+ channels or prevent the proper trafficking of these channels to the plasma membrane. The resulting loss in potassium permeability slows the repolarization of the membrane and delays the induction of the subsequent cardiac contraction, rendering the cardiac tissue susceptible to arrhythmias.
Prolongation of the cardiac action potential in this manner can also be induced by a number of therapeutic drugs. In particular, the K+ channel hERG (for human ether-a-go-go-related gene, named for its ortholog in Drosophila melanogaster) is highly susceptible to interactions with certain drugs. The hydrophobic regions of these drugs can block hERG by binding to two nonconserved aromatic residues on the internal surface of the channel cavity. In addition, this cavity is predicted to be wider than other K+ channels because of the absence of a conserved Pro-X-Pro motif within the S6 hydrophobic segment. Inhibition of hERG by these drugs can lead to an increased risk of cardiac arrhythmias and sudden death. Accordingly, a number of these agents, such as the antihistamine terfenadine, have been withdrawn from the market. Screening for the inhibition of hERG is now a critical safety hurdle for the pharmaceutical advancement of a molecule to an approved drug.