THE MARKET FOR LOANABLE FUNDS
The market for loanable funds is a model that describes the financial market for saving and investment. Initially, we will assume that savers deal directly with investors. This simplifies our analysis. We then will bring in financial intermediaries (banks, mutual funds, and other financial institutions) to describe the benefits of a well-
Supply and Demand for Loanable Funds
Why do people save? Why do they borrow? The first thought might be that people save because they can save. Unlike barter economies, money makes saving possible.
People supply funds to the loanable funds market because they do not spend all of their income; they save. There are many reasons why individuals save. People save “for a rainy day”: They put away some of their income when times are good to take care of them when times turn bad. Saving behavior is also a cultural phenomenon: Many countries, such as China, India, and France, have savings rates far higher than those in the United States.
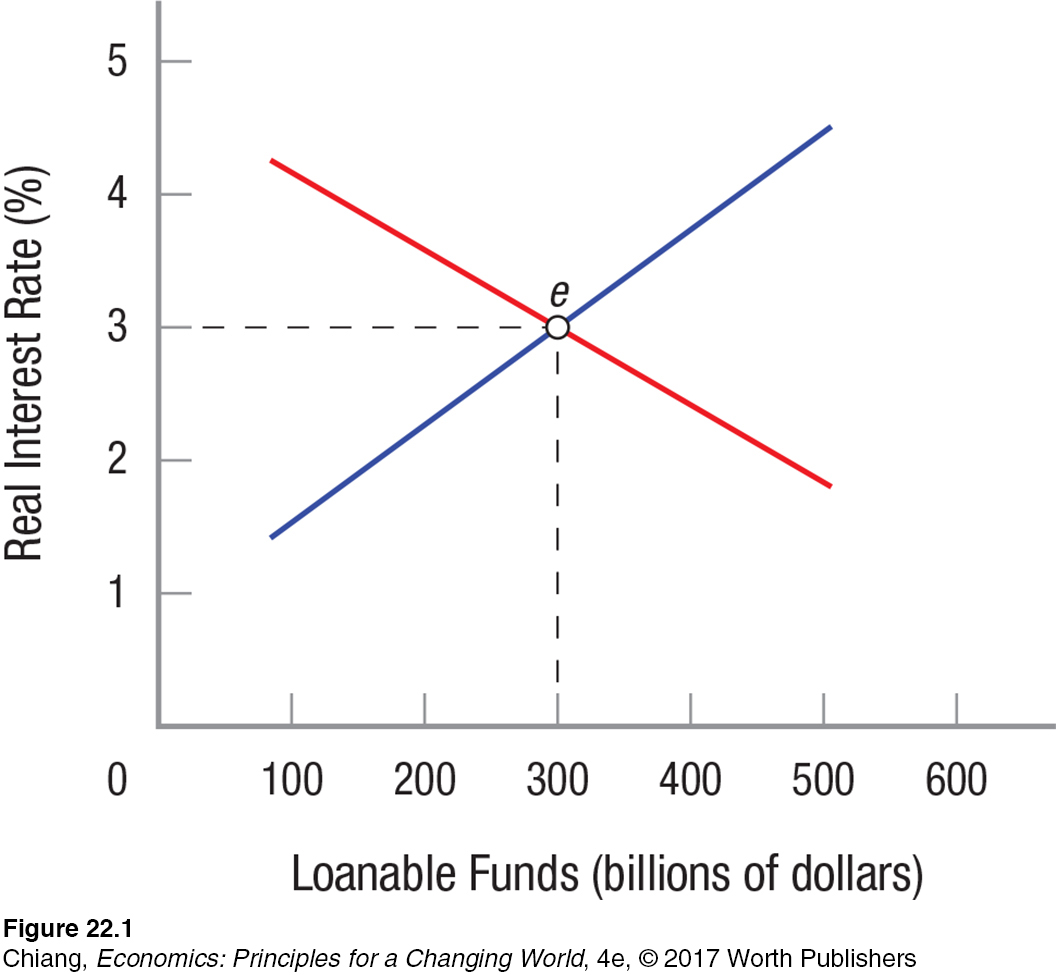
The reward for not spending today is the interest received on savings, enabling people to spend more in the future. Therefore, in the market for loanable funds shown in Figure 1, the quantity of loanable funds is measured on the horizontal axis, and the price of the funds (interest rate) is measured on the vertical axis. In this market, the supply curve represents savers, while the demand curve represents borrowers.

The supply of funds to the loanable funds market, shown as S0, is positively related to the interest rate. Because interest rates are the price (reward) that savers receive, higher interest rates result in more saving (funds) supplied to the market. This results in an upward-

The demand for loanable funds comes from people who want to purchase goods and services, such as taking out a loan to go to college, taking out a mortgage on a house, or who, as entrepreneurs, want to start or expand a business. Firms are borrowers, too. Firms may want to invest in new plants, additional equipment, expanded warehouse facilities, or engage in additional research and development on new products. The specific investment depends on the industry. For firms in the oil industry, it might be for an offshore oil platform or refinery. For a start-
The demand for loanable funds, shown as D0 in Figure 1, slopes downward because when the interest rate is high, fewer projects will have a rate of return high enough to justify the investment. A project will be undertaken only if its expected return (its benefit) is higher than the cost of funding the project. When oil prices fall, for example, an oil platform will not generate enough revenues to justify paying a high interest rate. As interest rates fall, more projects become profitable and the amount of funds demanded rises.
Keep in mind that when we refer to interest rates, we are referring to real interest rates (adjusted for inflation) that reflect the real cost of borrowing and the real return to savers.
The loanable funds market reaches equilibrium in Figure 1 at a 3% real interest rate and $300 billion in funds traded in the market. If for some reason the real interest rate exceeded 3%, savers would provide more funds to the market than investors want and interest rates would fall until the market reached point e. In a similar way, if interest rates were somehow below 3%, investors would want more funds than savers would be willing to provide. In this case, the market would push up interest rates to 3% at point e. Not surprisingly, this market is similar to the competitive markets for other goods and services. When compared to most markets, financial markets are typically more competitive and often reach equilibrium more quickly if something changes in the market. Let’s now use this model to analyze various impacts (private and public) on the market for loanable funds.
Just as in other markets, the market for loanable funds is subject to factors that shift the supply or demand for loanable funds. When this occurs, interest rates and the level of saving and investment also change.
Shifts in the Supply of Loanable Funds
A shift in the supply curve of loanable funds occurs when a factor increases or decreases the country’s willingness to save (either by private individuals or the public government) at any given interest rate. Changes in economic outlook, incentives to save, income or asset prices, and government deficits can influence savings patterns.
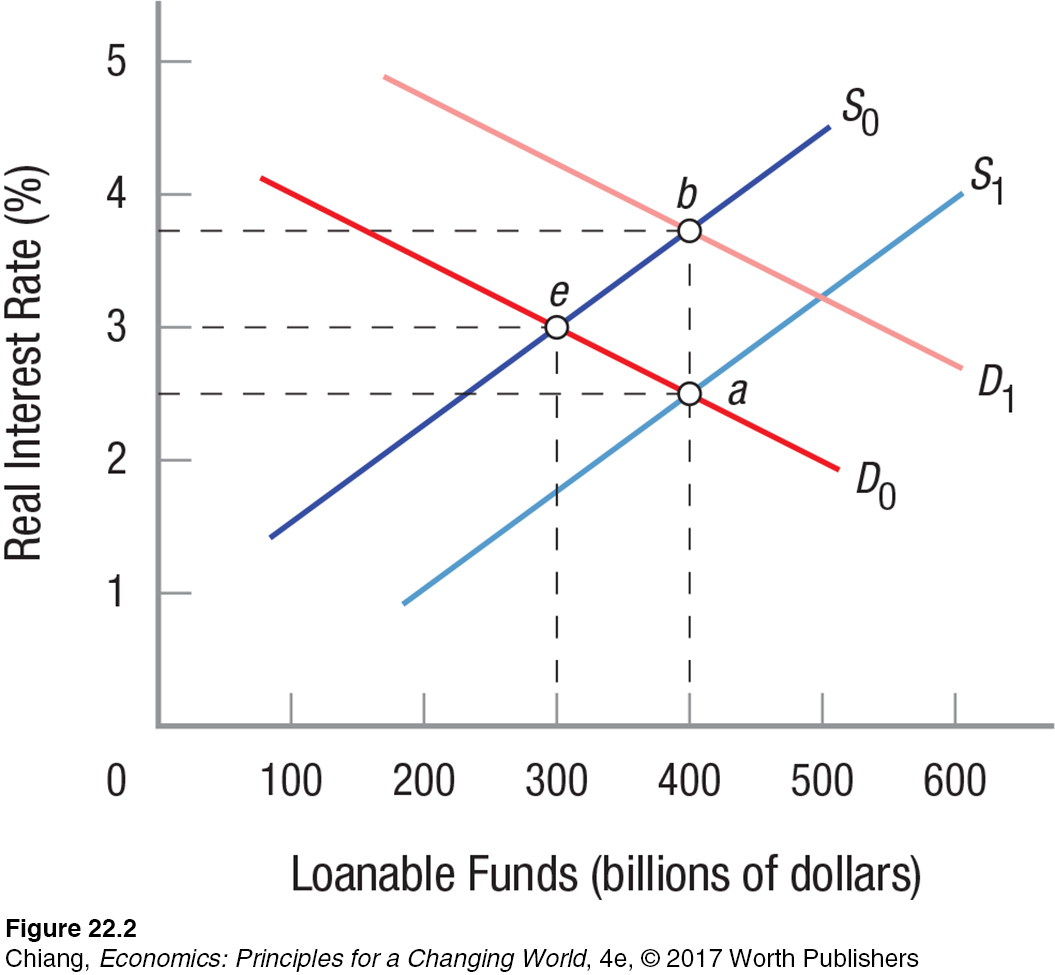
Economic Outlook Suppose households decide to save a larger proportion of their income because they fear job loss in a recession. If households decide to save more, the amount of funds provided to the market at all interest rates will increase, shifting the supply of loanable funds from S0 to S1 in Figure 2. Equilibrium will move from point e to point a, real interest rates will fall, and both saving and investment will rise from $300 billion to $400 billion. Similarly, if a recession ends and people go on a buying spree, savings will fall. In Figure 2, this would be a shift in the supply curve from S1 to S0.

Incentives to Save Governments and companies offer various incentives to individuals to save, such as retirement contribution plans and other tax incentives. Adjusting such incentives will change the level of savings accordingly.
Income or Asset Prices As incomes rise, people generally save a larger proportion of their income, all else equal. Asset prices, however, tend to work the other way. As home prices and stock values increase, people feel wealthier (without necessarily having more income) and will spend more and save less. The opposite effects occur when incomes fall or asset prices fall.
Government Deficits The supply of loanable funds includes both private and public saving. When a government runs a budget surplus, additional loanable funds are provided to the market, increasing the supply of loanable funds. However, governments often incur budget deficits, which means the government becomes a borrower instead of a saver. Governments borrow money by issuing bonds, which are then purchased by individuals and investors using their savings. Therefore, when governments borrow, they do so by reducing the amount that the private sector saves, which decreases the supply of loanable funds. Subsequently, interest rates rise, which crowds out consumption and investment, an effect discussed in the previous chapter.
Shifts in the Demand for Loanable Funds
We have seen how changes in savings can shift the supply of loanable funds. Now let’s turn our attention to the demand side. Anything that changes the rate of return on potential investment will cause the demand for loanable funds to change. Let’s keep saving on the initial supply curve, S0, in Figure 2.
Investment Tax Incentives Investment tax credits effectively reduce tax payments for firms building new factories or buying new equipment. These laws give firms incentives to invest by increasing their after-
An increase in investment demand would shift the demand for loanable funds from D0 to D1 in Figure 2 and results in both higher real interest rates (3.75%) and higher investment ($400 billion). An increase in business taxes would have the opposite effect on demand.
Technological Advances New technologies that increase productivity or create new products give businesses an incentive to increase production, which often results in plant expansion or the need to build an additional facility, increasing the demand for loanable funds.
Regulations Government regulations tend to influence the level of business investment. When regulations reduce corruption and instill confidence in firms and entrepreneurs, demand for investment will rise. But when regulations impose higher costs or make plant expansion difficult, the demand for investment will fall because the return on investment is reduced.
Product Demand When demand for a firm’s product or service increases, the return on investment rises. This increases the demand for loanable funds. The opposite is true when product demand falls.
Business Expectations When business sentiment about the economy rises, firms will tend to increase their investment demand, which increases the demand for loanable funds. When business sentiment falls, investment demand decreases and so does demand for loanable funds.
In summary, the market for loanable funds works just like any other market where one can use the familiar tools of supply and demand analysis. The only slight difference is that the price is represented by the real interest rate on loanable funds.
We have seen that when households decide to increase saving, real interest rates fall and investment rises. When the demand by firms for investment funds rises, real interest rates rise along with expanded investment. Together, saving and investment move toward equilibrium in the market for loanable funds.
CHECKPOINT
THE MARKET FOR LOANABLE FUNDS
Households supply loanable funds to the market because they spend less than their income and because they are rewarded with interest for saving.
Firms demand funds to invest in profitable opportunities.
The supply curve of funds is positively sloped; higher real interest rates bring more funds into the market. The demand for loanable funds is negatively sloped, reflecting the fact that at higher real interest rates, fewer investment projects are profitable.
Any policy that provides additional incentives for households to save will increase the supply of loanable funds, resulting in lower interest rates and greater investment.
Anything that increases the potential profitability (rate of return) of business investments will increase the demand for loanable funds, resulting in higher interest rates and investment.
QUESTIONS: A major downturn in an economy can bring about many consequences, including a reduction in business confidence in which firms become reluctant to invest, and an increased fear of job loss among workers. How do these two events affect the supply of savings and the demand for borrowing? What happens to the supply and demand curves found in Figure 2? Once the economy recovers, what is supposed to happen to these curves?
Answers to the Checkpoint questions can be found at the end of this chapter.
A fall in business confidence would reduce the demand for loanable funds, shifting the demand curve to the left in Figure 2. Meanwhile, increased insecurity about jobs will encourage people to save more, shifting the supply of savings to the right. These shifts create a huge surplus of funds at the original interest rate, and therefore interest rates would fall until a new equilibrium is reached. As the economy recovers, businesses resume their investments and consumers begin spending again, and the demand curve will shift back to the right and the supply curve would shift to the left. Interest rates would trend upward.