UNEMPLOYMENT
Unemployment is a phenomenon that affects nearly all workers at some point in their lives. When people become unemployed, the loss of wages often creates hardships on workers and their families. Moreover, the loss of income reduces consumer spending, which can lead to a ripple effect as businesses cut back production, leading to more workers losing their jobs.
The Historical Record
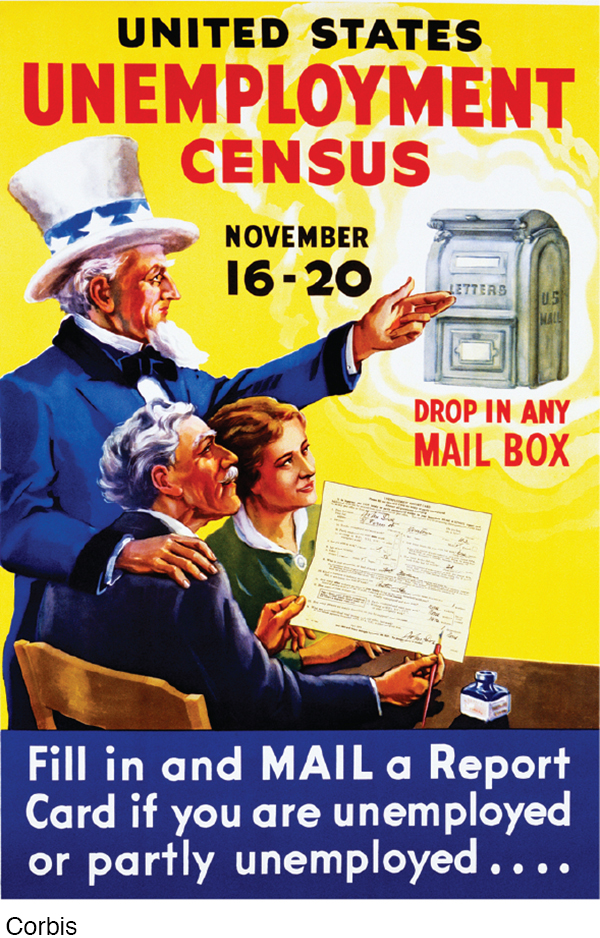
The Census Bureau began collecting data on wages and earnings in the early 19th century, but it took the Great Depression to focus national attention on the need for consistent data on unemployment rather than specific instances of things such as factory closings. By the 1940s, the Department of Labor began collecting employment data using monthly surveys to get a more detailed picture of the labor force. As the Bureau of Labor Statistics has noted,
To know about unemployment—
1 From the BLS Web site.
Once the BLS has collected and processed the current employment statistics, policymakers use this information to craft economic policies. Before we discuss how these statistics are defined, collected, used, and made accurate, let’s briefly look at the historical record of unemployment and its composition.
Figure 2 shows unemployment rates for the last century. Unemployment has varied from a high of 25% of the labor force in the middle of the Great Depression to a low of just over 1% during World War II. Unemployment during the past 50 years has tended to hover around the 5% to 6% range, although it reached 10% during the 1981–
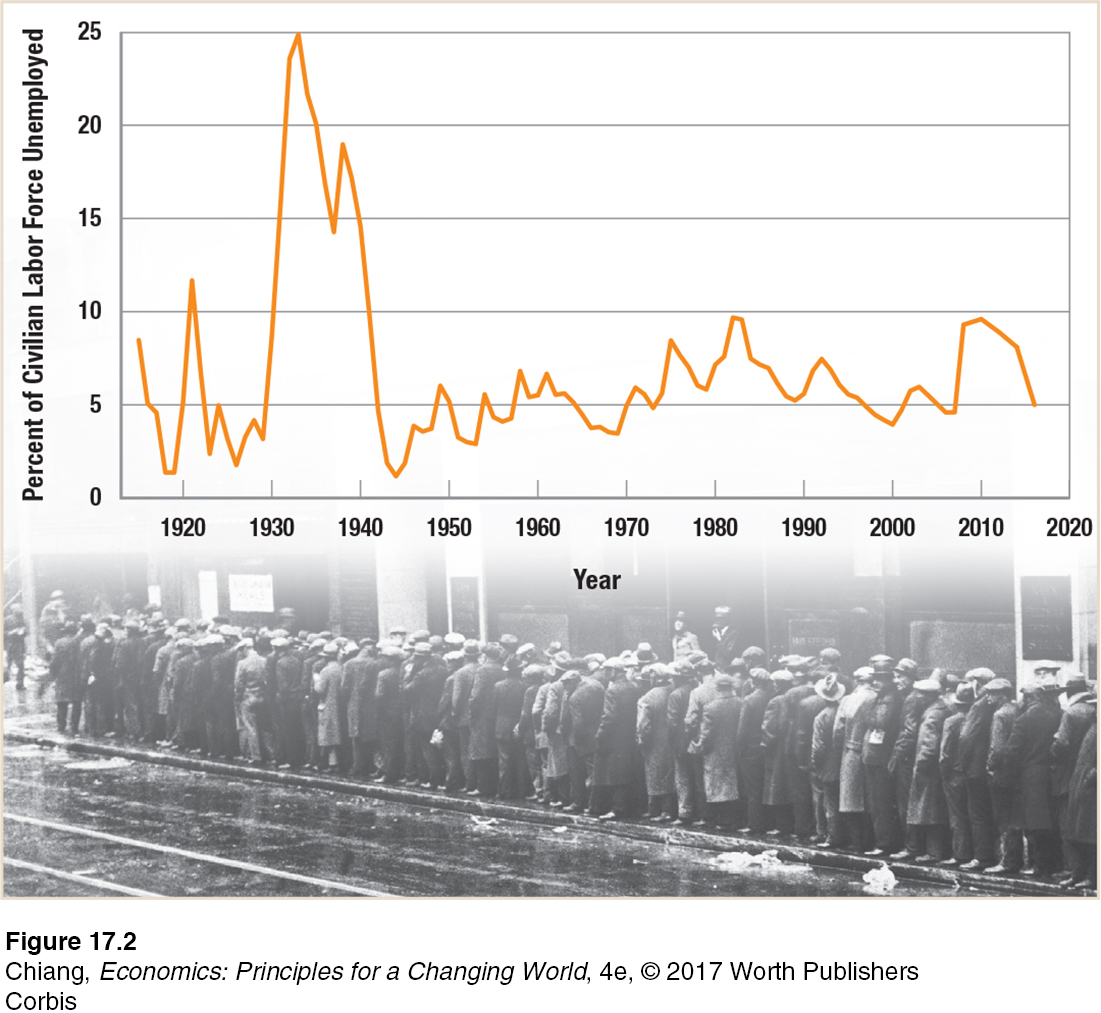
Table 2 shows a breakdown of unemployment among various groups by gender, race, and education for 1985, 1995, 2005, and 2015. For blacks, unemployment has tended to be more than double the rate of white unemployment, and the unemployment rate for Hispanics has usually exceeded that for whites by roughly 50%. Unemployment for college graduates is consistently low. Roughly half of all unemployment is normally from job losses, but this rose to two-
| TABLE 2 | UNEMPLOYMENT RATES BY GENDER, RACE, EDUCATION, OCCUPATION, AND REASON FOR UNEMPLOYMENT, 1985– |
|||||
| Industry | 1985 | 1995 | 2005 | 2015 | ||
| Total unemployment | 7.2 | 5.6 | 5.1 | 5.3 | ||
| Gender | ||||||
| Men | 7.0 | 5.6 | 5.1 | 5.4 | ||
| Women | 7.4 | 5.6 | 5.1 | 5.2 | ||
| Race or Ethnicity | ||||||
| White | 6.2 | 4.9 | 4.4 | 4.6 | ||
| Black | 15.1 | 10.4 | 10.0 | 9.6 | ||
| Hispanic | 10.5 | 9.3 | 6.0 | 6.6 | ||
| Education | ||||||
| Less than high school diploma | 8.5 | 9.0 | 7.6 | 8.0 | ||
| High school graduate | 5.2 | 4.8 | 4.7 | 5.4 | ||
| Less than bachelor’s degree | 4.4 | 4.0 | 3.9 | 4.5 | ||
| College graduate and higher | 2.2 | 2.4 | 2.3 | 2.6 | ||
| Occupation | ||||||
| Managerial and professional | 3.0 | 2.2 | 2.3 | 2.5 | ||
| Office and administrative support | 5.2 | 4.3 | 4.6 | 4.7 | ||
| Production occupations | 8.8 | 8.7 | 6.7 | 5.7 | ||
| Reason Why Unemployed | ||||||
| Job loser | 3.6 | 2.6 | 2.5 | 2.6 | ||
| Job leaver | 0.8 | 0.6 | 0.6 | 0.5 | ||
| Reentrant | 2.0 | 1.9 | 1.6 | 1.6 | ||
| New entrant | 0.9 | 0.4 | 0.4 | 0.6 | ||
Data from U.S. Department of Labor, Bureau of Labor Statistics (Historical Data Series, CPS Database).
Now that we have some idea of the composition of the unemployed, let us consider just how these numbers are compiled. First, we need to examine how people get categorized as employed or unemployed.
Defining and Measuring Unemployment
The three major monthly numbers the BLS reports are the size of the labor force, number of people employed, and number unemployed. The unemployment rate is the number of people unemployed divided by the labor force.
Employed People are counted as employed if they have done any work at all for pay or profit during the survey week. Regular full-
One other group, called unpaid family workers, is considered to be employed. These are people who work 15 or more hours a week in a family enterprise; they usually show up in agriculture and retail. Unpaid family workers who work fewer than 15 hours a week are not counted as employed.
Unemployed People are counted as unemployed if they do not have a job, but are available for work and have been actively seeking work for the previous four weeks. Actively looking for work includes efforts such as responding to online job ads, sending off résumés, scheduling job interviews, visiting school placement centers, and contacting private or public employment agencies.
Note the emphasis on being active in the job search. A passive job search that merely involves browsing online employment openings or talking to friends about jobs is not enough to characterize someone as unemployed. One exception involves workers who have been laid off but are expecting to be recalled; they do not need to seek other work to count as being unemployed. Aside from the only other exception—
labor force The total number of those employed and unemployed. The unemployment rate is the number of unemployed divided by the labor force, expressed as a percent.
Labor Force The labor force is the total number of those employed and unemployed. The unemployment rate is the number of unemployed divided by the labor force, expressed as a percent.
The measurement of the labor force has important implications for the unemployment rate. To be counted in the labor force, one must either be employed or not employed, but actively seeking work. As a result, a number of groups are not included in the labor force, including full-
Monthly Employment Surveys
The Census Bureau and the Department of Labor conduct different surveys to measure employment. The Census Bureau surveys households and the U.S. Department of Labor focuses on the payrolls of businesses and government agencies to produce their monthly reports.
The Household Survey Every month the Census Bureau, as part of the Current Population Survey (CPS), contacts roughly 60,000 households to determine the economic activity of people. The sample is drawn from over 700 geographical areas intended to represent the entire country, including urban and rural areas. The survey includes self-
The Census Bureau does not directly ask interviewees if they are employed. Rather, it asks a series of questions designed to elicit information that permits the Bureau to determine by its own standards whether people are employed or unemployed and whether they are in the labor force.
The Payroll Survey Officially called the Current Employment Statistics (CES) Survey, the payroll or establishment survey focuses on approximately 146,000 companies and government agencies that are asked how many employees they currently have. If jobs are cut, this survey will immediately show a decrease in the number of employees.
According to the Bureau of Labor Statistics, “Both the payroll and household surveys are needed for a complete picture of the labor market. The payroll survey provides a highly reliable gauge of monthly changes in nonfarm payroll employment. The household survey provides a broader picture of employment including agriculture and the self-
2 U.S. Department of Labor, Bureau of Labor Statistics, Employment from the BLS Household and Payroll Surveys: Summary of Recent Trends, 2016, http:/
The household survey provides a detailed demographic picture of the labor market and captures entrepreneurial activity missed by the payroll survey. In contrast, the payroll survey provides detailed information by industry and region of the country. Because the payroll survey has a larger sample, it is generally viewed as the most accurate gauge of employment and unemployment changes, but both surveys closely track each other.
Employment Trends
The surveys described in the previous section are important measures of employment and unemployment for the country as a whole as well as for individual states and cities included in the surveys. However, investors and economists are interested in trends in employment and how they affect the overall health of the economy. Although major companies are highlighted in the news for their decisions on hiring and laying off workers, the majority of jobs in the country are generated by small and mid-
Weekly Jobs Report One report that has gained increasing attention is the Unemployment Insurance Weekly Claims Report, more commonly referred to as the Weekly Jobs Report, released by the U.S. Department of Labor each Thursday. The Weekly Jobs Report contains an estimate of the number of persons filing for unemployment benefits for the first time, and is used as a way to estimate trends in layoffs and in hiring. Economists are interested in seeing how the weekly data change from week to week. These data provide a more immediate estimate of unemployment than waiting for the monthly survey report.
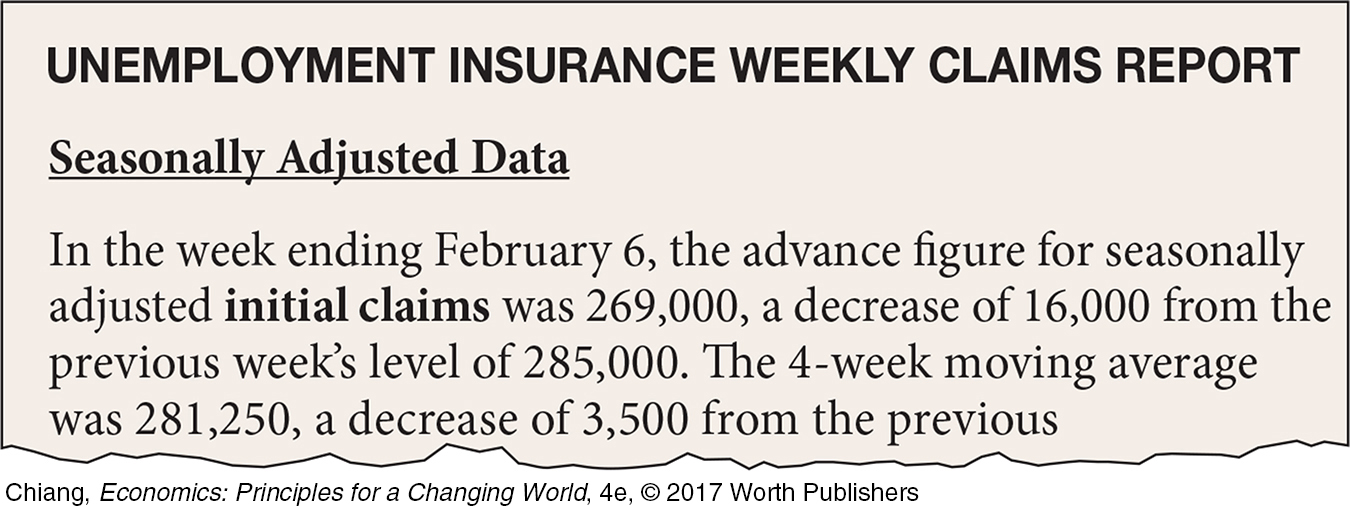
The Weekly Jobs Report released on February 11, 2016, shows initial unemployment claims of 269,000. Of importance to economists is that the number decreased from the previous week (along with the four-
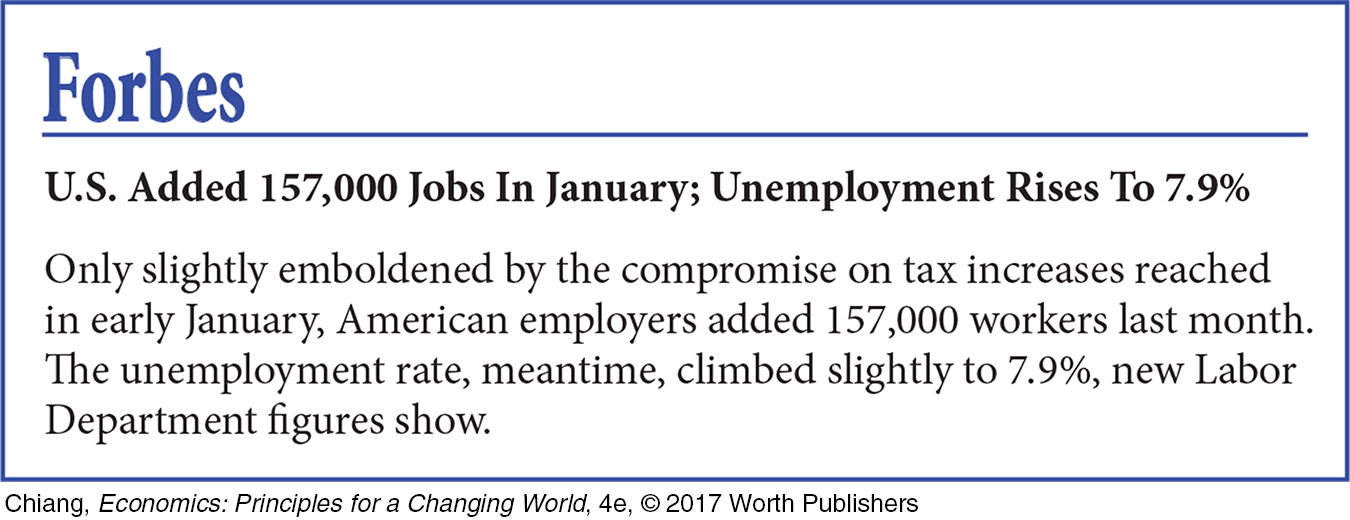
This headline from Forbes (February 2, 2013) appears odd because the unemployment rate in January 2013 rose despite many jobs being created. This occurred because the labor force increased as more people began looking for work again.
Relationship Between Employment and the Unemployment Rate People often generalize the negative relationship between employment and the unemployment rate. Although these terms are negatively related, the relationship is not perfect. For example, it is possible for employment to grow and the unemployment rate to increase at the same time. Recall that the unemployment rate measures the number of people unemployed and seeking work divided by the labor force. The important point to highlight here is that the labor force is constantly changing.
The labor force changes for many reasons. For example, the labor force in the United States grows by around 1.5 million persons each year just from population growth (from natural births as well as from immigration). Therefore, even without considering any other factor influencing the labor force, the United States needs to generate numerous new jobs just to keep the unemployment rate steady. Further, people enter and leave the labor force for many reasons—
Problems With Unemployment Statistics
Analyzing issues as complex and personal as employment, unemployment, and job seeking can be expected to generate its share of criticism. When the Department of Labor announces its results each month, commentators often note that these numbers understate unemployment, because they do not include chronically unemployed workers who have grown so frustrated and discouraged that they have dropped out of the labor force. Media pundits agonize over the plight of discouraged workers or the underemployed while discussing the impact of the latest numbers on the stock market.
How unemployment is measured depends on the intended use of the resulting measurements. Various uses for unemployment statistics include (1) gauging the state of the economy, (2) determining the divergence of supply and demand in labor markets, and (3) assessing the distribution of unemployment and the extent to which people are suffering from being out of work. In the United States, most unemployment statistics have been developed to gauge the state of the economy. The Bureau of Labor Statistics does, however, publish data about underemployment, discouraged workers, and other marginally attached workers.
Underemployment and Marginally Attached Workers It is not uncommon for people to take jobs that do not fully use their skills. In the early 1990s, many engineers and skilled workers who were employed in the defense industry saw their careers fall apart with the collapse of the Soviet Union. The “peace dividend” most people enjoyed generated excess supplies in defense-
underemployed workers Workers who are forced to take jobs that do not fully utilize their education, background, or skills. Underemployed workers often hold part-
marginally attached workers Workers who were available for work and actively looked for it during the last 12 months, but not in the last 4 weeks.
discouraged workers Discouraged workers are the portion of marginally attached workers who have given up actively looking for work and, as a result, are not counted as unemployed.
As a result of these shake-
Another common situation that occurs during economic downturns is that people give up looking for work altogether. The Department of Labor categorizes those who were available for work and actively looked for it during the last 12 months, but not in the last 4 weeks, as marginally attached workers. Marginally attached workers are not counted in the official unemployment statistics, because they are not considered part of the labor force.
The reasons that people stop looking for work vary, but the most common reason is a person’s belief that there simply aren’t any good jobs available, and he or she consequently gives up looking for work until the labor market improves. This portion of marginally attached workers is called discouraged workers. The deeper the recession, the more discouraged workers there will be. Other reasons for being marginally attached include giving up the search for work due to family responsibilities or transportation problems.
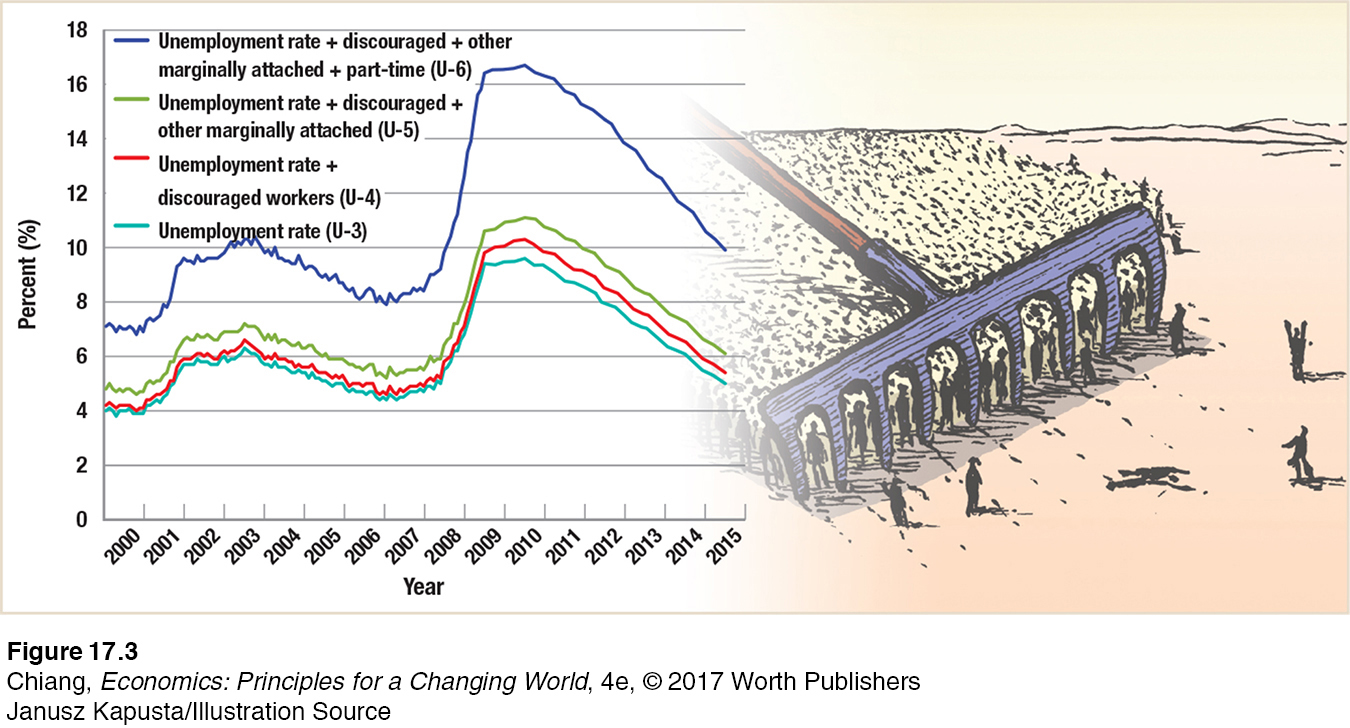
Today, the Census Bureau asks other questions of respondents to determine whether they fit into the categories of a discouraged worker, other marginally attached worker, or underemployed worker. These data are then reported by the Bureau of Labor Statistics to provide a more comprehensive analysis of the employment situation. Figure 3 shows a breakdown of unemployed, discouraged, other marginally attached, and underemployed (measured by those working part-
Other countries have different definitions of actively seeking work, classifying individuals engaged in passive job searches as unemployed. Notably, Canada and Europe have more relaxed search standards than the United States.

The Boom and Bust of Dickinson, North Dakota
How did the expansion of the oil industry affect prices and employment in Dickinson, and how quickly did it unravel?
From 2010 to 2013, when much of the United States was recovering from a severe recession, one town experienced a boom. High school graduates without specialized skills were earning six-
How did this small remote city in western North Dakota experience such a rapid rise and subsequent bust?

Dickinson is not an easy city to spot on a map, nor one that is easy to get to, being over 500 miles from the nearest major airport hub. But because of its proximity to the Bakken Formation, one of the largest oil and natural gas deposits in North America, Dickinson became a destination for workers across the country seeking lucrative job opportunities that were readily available, created by the high price of oil which kept the industry very profitable.
Although jobs were seemingly endless and unemployment practically nonexistent, the boom led to shortages of goods and services, especially housing, which couldn’t keep up with demand due to the city’s remote location. As a result, prices rose significantly in Dickinson and in other towns in the region. Anecdotal evidence of high inflation abounded as Dickinson residents paid rents that would be more expected in Los Angeles than in North Dakota, and where in a trip to a grocery store one might encounter prices that resemble those of a convenience store.
But alas, the boom of Dickinson would not last. As oil prices plummeted by over 60% from 2014 to 2016, oil drilling in North Dakota was no longer profitable for many companies. As a result, most drilling rigs were abandoned, resulting in rising unemployment that forced many newly arrived residents to pack up again and leave. The silver lining for residents of Dickinson is that prices fell, making living in the remote western region of North Dakota affordable once again.
CHECKPOINT
UNEMPLOYMENT
People are counted as employed if they are at least 16 years old, not institutionalized, and have worked for pay or profit during the survey week.
People are unemployed if they do not have a job, but are available for work and have been actively seeking work for the previous four weeks.
The labor force is the sum of the employed and unemployed. The unemployment rate is the number of unemployed divided by the labor force.
The official unemployment rate statistics do not account for underemployed, discouraged, and other marginally attached workers.
QUESTIONS: Does it seem reasonable to require that to be counted as unemployed, a person must be actively seeking work? Why not just count those who do not have a job but indicate they would like to work?
Answers to the Checkpoint questions can be found at the end of this chapter.
The reason for the requirement that a person actively seek work is to differentiate empirically those who profess to want a job (at possibly a higher wage than they can earn in the market) from those who are actively trying to obtain work.