TOTAL REVENUE AND OTHER MEASURES OF ELASTICITY
Elasticity is important to firms because elasticity measures the responsiveness of quantity sold to changes in price, which provides valuable information to firms in deciding whether to increase or decrease prices. Owners of a restaurant that is completely full each evening might ponder raising its prices, but only if it can retain most of its customers. Another restaurant, which has few customers, might wish to lower its prices to generate more business, but only if it generates enough business to offset the lower prices it charges.
Elasticity is also important because it allows firms to determine how a change in the price of one product might affect the demand for other items, or how changes in economic conditions might affect the market for their goods. If a supermarket discounts the price of sirloin steaks, how would this affect the demand for other cuts of beef, or other meats? Would it increase sales of steak sauce and potatoes? These are questions we address in this section using other measures of elasticity.
Elasticity and Total Revenue
total revenue Price × quantity demanded (sold). If demand is elastic and price rises, quantity demanded falls off significantly and total revenue declines, and vice versa. If demand is inelastic and price rises, quantity demanded does not decline much and total revenue rises, and vice versa.
The elasticity of demand, which we learned about in the previous section, has an important effect on the total revenues of the firm. Total revenue (TR) is equal to the number of units sold (Q) times the price of each unit (P), or
TR = Q × P
The sensitivity of output sold to price changes greatly influences how much total revenue changes when price changes.
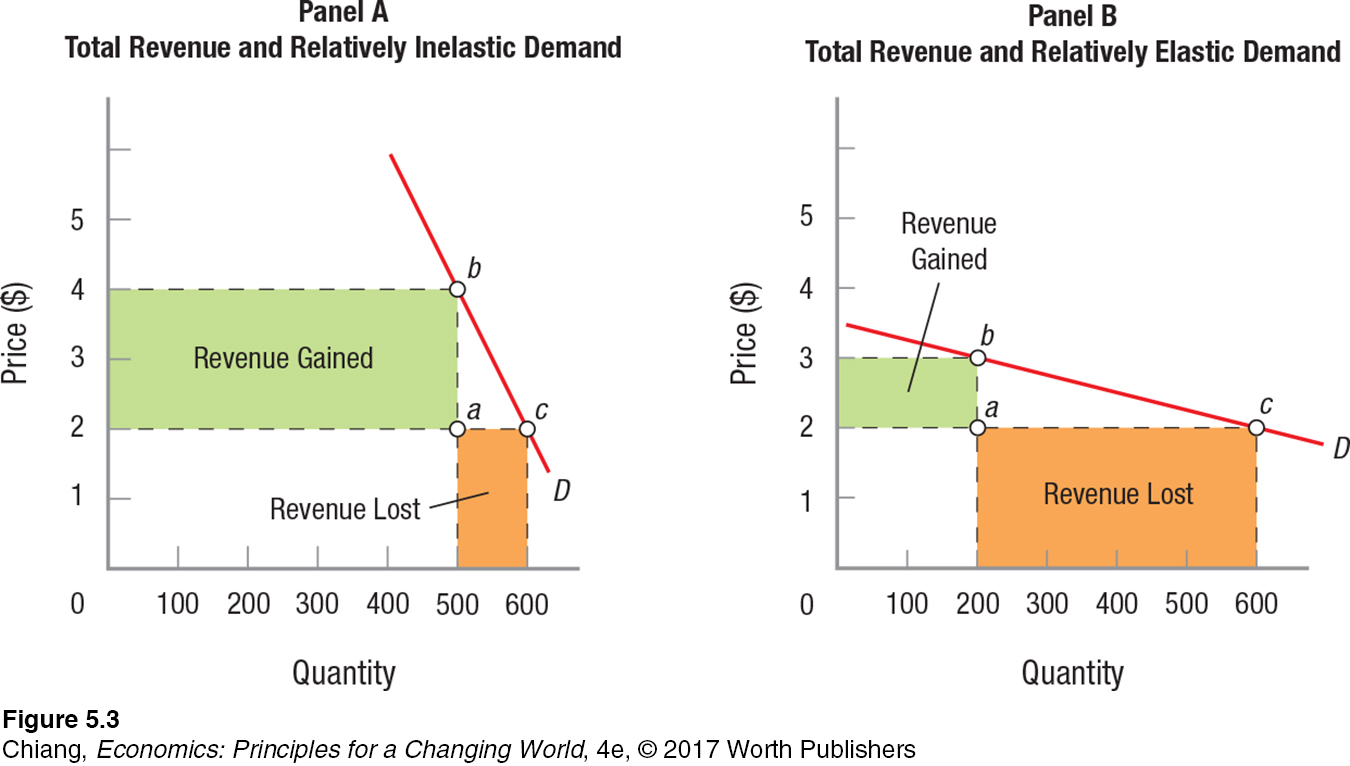
Inelastic Demand When consumers are so loyal to a product or so few substitutes exist that consumers continue to buy the product even when its price goes up, the demand for that product is elastic. Panel A of Figure 3 shows the impact of a price increase on total revenue when the demand for a product is inelastic. Price rises from $2.00 to $4.00, and sales decline from 600 to 500 units. In this case, total revenue rises. We know this because the revenue gained from the price hike [($4.00 – $2.00) × 500 = $1,000] is greater than the revenue lost [($2.00 × (600 – 500) = $200]. We can see this by comparing the size of the area labeled “Revenue Gained” with the area labeled “Revenue Lost” in the figure. What has happened here? The price hike has driven off only a few customers, but the firm’s many remaining customers are paying a much higher price, thus driving up the firm’s total revenue.
This may suggest that firms would always want the demand for their products to be inelastic. Unfortunately for them, inelastic demand has a flip side. Specifically, if supply increases (due to a technical advance, say), sales will rise only moderately, even as prices fall dramatically. This leads to a drop in total revenue: Consumers indeed buy more of the product at its new lower price, but not enough to offset the lower price per unit received by firms.
Elastic Demand Elastic demand is the opposite of inelastic demand. Firms with elastically demanded products will see their sales change dramatically in response to small price changes. Panel B of Figure 3 shows what happens to total revenue when a firm increases the price of a product with elastic demand. Although price does not increase much, sales fall significantly. Revenue lost greatly exceeds the revenue gained from the price increase; thus, total revenue falls.
The opposite occurs when prices fall and demand is elastic. The high elasticity of demand faced by restaurants helps explain why so many of them offer “Happy Hour” specials and other discounts. As prices fall, sales have the potential to expand rapidly, thus increasing revenue.
Unitary Elasticity We have looked at the impact of changing prices on revenue when demand is elastic and inelastic. When the elasticity of demand is unitary (Ed = 1), a 10% increase in price results in a 10% reduction in quantity demanded. As a result, total revenue is unaffected.
Table 2 summarizes the effects price changes have on total revenue for different price elasticities of demand.
| TABLE 2 | TOTAL REVENUE, PRICE CHANGES, AND PRICE ELASTICITY OF DEMAND | ||||
| Elasticity | Elasticity | ||||
| Price Change | Inelastic | Elastic | Unitary Elastic | ||
| Price increases | TR increases | TR decreases | No change in TR | ||
| Price decreases | TR decreases | TR increases | No change in TR | ||
Elasticity and Total Revenue Along a Straight-
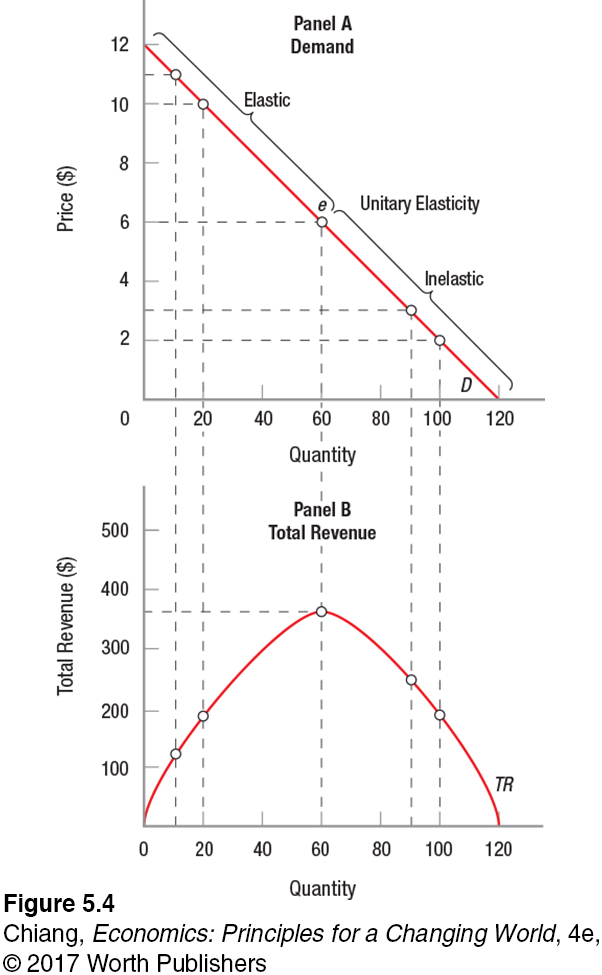
As we move down the demand curve, elasticity will eventually equal 1 (at point e), where elasticity is unitary elastic. Price was falling up to this point, while total revenue kept rising until the last price reduction just before $6, where revenue did not change. Revenue is at its maximum at point e or a price of $6.
As price continues to fall below $6, the demand curve moves into an inelastic range because the percentage change in quantity demanded is less than the percentage change in price. Therefore, when price falls from $3 to $2, revenue declines. The revenue gained ($20) is less than the revenue lost ($90). This decline in revenue is shown in panel B, as total revenue falls as output rises from 90 to 100 units sold.
To summarize, elasticity changes along a negatively sloped linear demand curve because the percentage change in price and quantity varies along the curve. When the price of a product is low, a 1-
Other Elasticities of Demand
Besides the price elasticity of demand, two other elasticities of demand are important. The first, cross elasticity of demand, measures how changes in the price of one good affect the demand for other related goods. If Toyota is planning a price reduction, what impact will this have on the sale of Fords? Ford will want to estimate this to decide whether to ignore Toyota or lower its own automobile prices.
Another type of elasticity measures how responsive quantity demanded is to changes in income. This is called income elasticity of demand. Incomes vary as the economy expands or contracts. To plan their future employment and production, many industries want to know how the demand for their products will be affected when the economy changes. How much will airline travel be affected if the economy moves into a recession? What will happen to sales of lattes at Starbucks? Each business faces a different situation.
Let’s consider these two elasticities of demand more closely, beginning with cross elasticity of demand.
cross elasticity of demand A measure of how responsive the quantity demanded of one good is to changes in the price of another good.
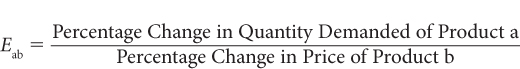
Cross Elasticity of Demand Cross elasticity of demand (Eab) measures how responsive the quantity demanded of one good (product a) is to changes in the price of another (product b):
substitutes Goods consumers substitute for one another depending on their relative prices, such as coffee and tea. Substitutes have a positive cross elasticity of demand.
Using cross elasticity of demand, we can classify goods in two ways. Products a and b are substitutes if their cross elasticity of demand is positive (Eab > 0). Common sense tells us that chicken and turkey are substitutes. Therefore, if the price of turkey rises, people will substitute away from turkey and toward chicken; thus, the quantity demanded for chicken will grow. This illustrates a positive cross elasticity. Similar relationships exist between Toyota and Honda cars, wireless services provided by AT&T and Verizon, and the price of gas and public transportation.
complements Goods that are typically consumed together, such as coffee and sugar. Complements have a negative cross elasticity of demand.
Second, products a and b are complements if their cross elasticity of demand is negative (Eab < 0). This is an instance in which the minus sign conveys important information. Complementary products are those goods and services that are consumed together, such as lift tickets and snowboard rentals. When the price of lift tickets rises, the result is that the demand for snowboard rentals falls as fewer people head to the mountains. Other complementary goods include coffee and cream, hamburgers and french fries, and hot dogs and hot dog buns. Finally, two goods are not related if a cross elasticity of demand is zero, or near zero.
income elasticity of demand A measure of how responsive quantity demanded is to changes in consumer income.
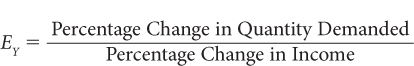
Income Elasticity of Demand The income elasticity of demand (EY) measures how responsive quantity demanded is to changes in consumer income. We define the income elasticity of demand as
normal goods Goods that have positive income elasticities less than 1. When consumer income grows, demand for normal goods rises, but less than the rise in income.
Depending on the value of the income elasticity of demand, we can classify goods in three ways. First, a normal good is one whose income elasticity is positive, but less than 1 (0 < EY < 1). As income rises, quantity demanded at any given price rises as well, but not as fast as the rise in income. Most products are normal goods. If your income doubles, you will probably buy more sporting equipment and restaurant meals, but not twice as many.
luxury goods Goods that have income elasticities greater than 1. When consumer income grows, demand for luxury goods rises more than the rise in income.
inferior goods Goods that have income elasticities that are negative. When consumer income grows, demand for inferior goods falls.
A second category, income superior goods or luxury goods, includes products with an income elasticity greater than 1 (EY > 1). As income rises, quantity demanded at any given price grows faster than income. Goods and services such as Mercedes automobiles, caviar, fine wine, and visits to European spas are examples of luxury or income superior goods.
Finally, inferior goods are those goods for which income elasticity is negative (EY < 0).When income rises, the quantity demanded at any given price falls. Inferior goods include potatoes, beans, cheap motels, and nosebleed section concert tickets. Get yourself a nice raise, and you will probably buy concert tickets that let you see the band up close and personal.
ISSUE
Using Loss Leaders to Generate Higher Total Revenue
At the start of each school year, office supply stores will often advertise items for as low as 1 cent. These items typically are essential school supplies such as paper, pencils, and folders that parents need to buy for their children. Because school supplies are necessities and generally low-
The answer lies not in how prices for school supplies affect total revenue, but instead the effect that those remarkably low prices, known as loss leaders, have on the cross elasticity of demand for pricier items, such as laptops, color printers, and office furniture, sold at the store. In other words, the practically free school supplies are used as an incentive to attract parents into the store.

Wouldn’t some parents just buy the school supplies on sale and nothing else? Some actually do. But the potential gain from just one customer choosing to buy a high-
Loss leaders are an effective advertising tool to increase total revenues from the sale of higher-
Keep in mind that inferior goods are not necessarily poor in quality; they simply describe goods that one buys fewer of as income increases, and vice versa. Therefore, inferior goods can vary from person to person. Nosebleed seats might be an inferior good for an avid concertgoer, but can be a normal good to a person who rarely goes to concerts.

Understanding how product sales are affected by changing incomes and economic conditions can help firms diversify their product lines so that sales and employment can be stabilized to some extent over time. For example, firms that produce all three types of goods can try to switch production toward the good that current economic conditions favor: In boom times, production is shifted more toward the making of luxury goods. Chevrolet will produce more Corvettes in boom times, and more Chevy Sparks during economic slowdowns.
This is a good place to stop and reflect on what we have discovered so far. We have seen that elasticity measures the responsiveness of one variable to changes in another. Elasticity measures changes in percentage terms so that products of different magnitudes—
CHECKPOINT
TOTAL REVENUE AND OTHER MEASURES OF ELASTICITY
When demand is inelastic and prices rise, total revenue rises. When demand is inelastic and prices fall, total revenue falls.
When demand is elastic and prices rise, total revenue falls. When demand is elastic and prices fall, total revenue rises.
Straight-
line demand curves show three regions: elastic demand (at higher prices), unitary elastic demand, and inelastic demand (at lower prices). Cross elasticity of demand measures how responsive the demand of one product is to price changes of another. Substitutes have positive cross elasticities, while complements have negative cross elasticities.
Income elasticity of demand measures how responsive demand is to changes in income. This determines whether a good is a luxury, normal, or inferior good.
QUESTION: Two clothing stores located in the same shopping center have a big sale: 20% off on everything in the store. After the sale, Store 1 finds that its total revenue has increased, while Store 2 finds that total revenue has decreased. What does this tell you about the price elasticity of demand for the clothes in each store?
Answers to the Checkpoint questions can be found at the end of this chapter.
Store 1 has an elastic demand for its clothes, while store 2 faces an inelastic demand. Look back at Table 2.