SUMMARY
Describe what two-way ANOVA does.
Two-way ANOVA measures the impact of two explanatory variables on a dependent variable. It divides the variability in the dependent variable into that due to each explanatory variable separately (the main effects) and that due to them together (the interaction effect).
The interaction effect is an advantage of two-way ANOVA over one-way ANOVA. An interaction effect means that the impact of one explanatory variable depends on the level of the other explanatory variable. When there is a statistically significant interaction effect, the main effects are not interpreted.
Complete a between-subjects, two-way ANOVA.
Use between-subjects, two-way ANOVA when there are two explanatory variables, each with at least two levels, the samples are independent, and the dependent variable is measured at the interval or ratio level.
Conducting a two-way ANOVA follows the same procedure as is used for other hypothesis tests. That is, check the assumptions (random samples, independence of observations, normality, and homogeneity of variance); form null and alternative hypotheses for each main effect and for the interaction; calculate degrees of freedom; find the critical value of F ; set the decision rule; and, finally, find the value of the test statistic by completing an ANOVA summary table.
Interpret a between-subjects, two-way ANOVA.
First, determine if the null hypotheses were rejected and write the results in APA format. Then, calculate eta squared as an effect size. If the null hypothesis was rejected, complete post-hoc tests (Tukey HSD) to determine where the effects are and what their direction is.
Finally, write a four-point interpretation (What was done? What was found? What does it mean? What suggestions are there for future research?).
DIY
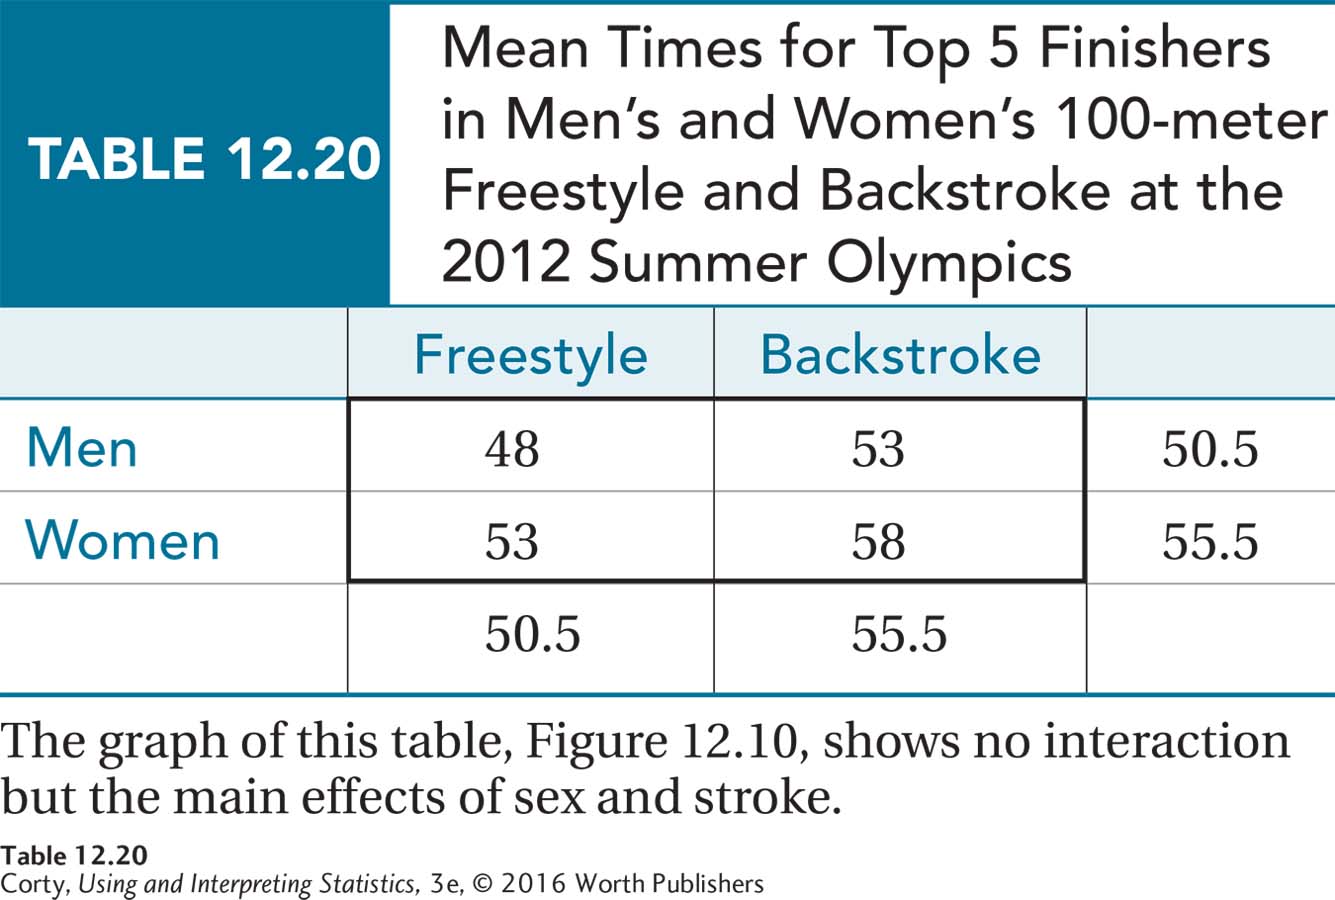
Two-way ANOVA allows us to examine the impact of two explanatory variables at once. For example, we can look at two sporting events, like swimming, that are structured the same for men and women. Table 12.20 displays the mean times, in seconds, for the top five finishers in the 100-meter freestyle and 100-meter backstroke at the 2012 Summer Olympics.

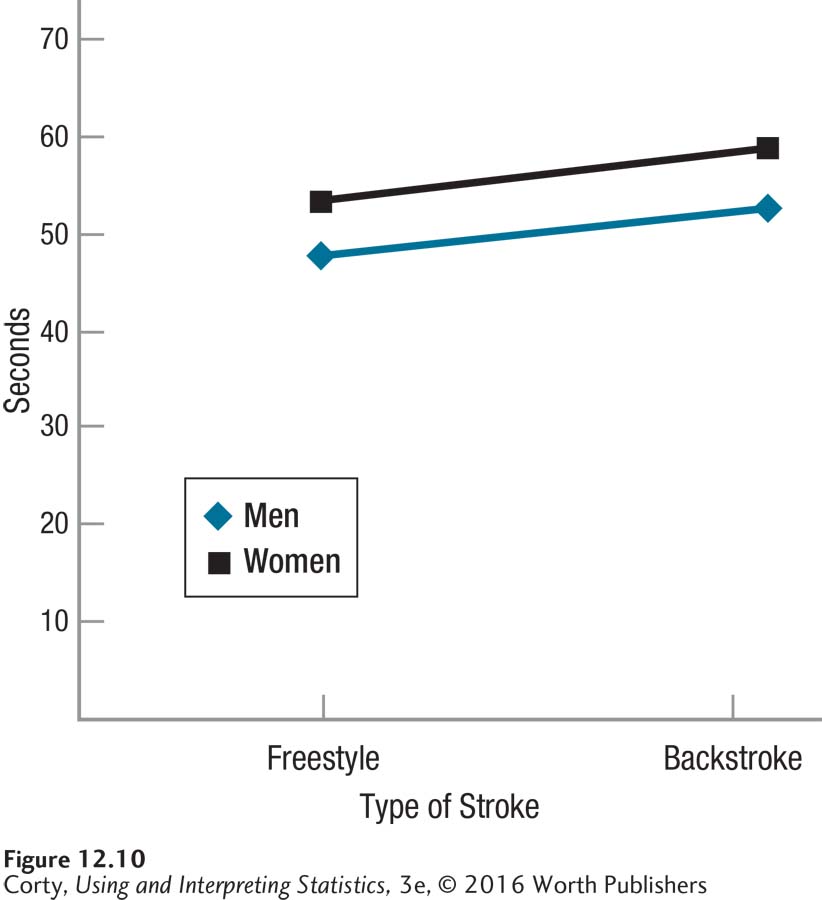
Figure 12.10 is a graph of the results. What does the graph suggest about the “main effects” of sex and type of stroke as well as the interaction of these two variables? From the graph, it is clear that there is no interaction between sex and stroke and that there are probably main effects of sex and stroke. The main effect of sex, if it is statistically significant, says that no matter the stroke, men swim about five seconds faster over a 100-meter distance. If the main effect of stroke is statistically significant, it would be interpreted as saying that both men and women are about five seconds faster when they cover 100 meters by freestyle rather than backstroke.

Note that the lack of an interaction means that these effects are independent and cumulative. Men are five seconds faster than women and freestyle is five seconds faster than backstroke. Thus, men swimming the freestyle are ten seconds faster than women doing the backstroke.
Now it’s your turn. Find some data that vary on two dimensions. Need ideas? See the bulleted examples below. Put the data in a table like the one above. Be sure to label the rows and columns and to calculate marginal values. Graph the results and interpret the graph.
Sporting events that are structured the same for men and women, at the Olympic, national, collegiate, or high school level
Sporting events compared across different levels (e.g., high school vs. college)
Average SAT scores, math vs. reading/writing, for different colleges
Average salaries, men vs. women, for different professions