1.5 Statistical Notation and Rounding
The data that statisticians work with are almost always in the form of numbers. When statisticians refer to the outcome variable that the numbers represent, they abbreviate it with the letter X. If they were measuring age in a group of children, they would say X = age. Another common abbreviation is N to indicate the number of cases. If statisticians measured the ages of five children, they would say N = 5.
When adding together sets of scores, an uppercase Greek sigma (Σ) is used as a summation sign. If the five kids had ages of 5, 7, 10, 11, and 15, then ΣX means that one should add together all the X scores:
ΣX = 5 + 7 + 10 + 11 + 15
= 48
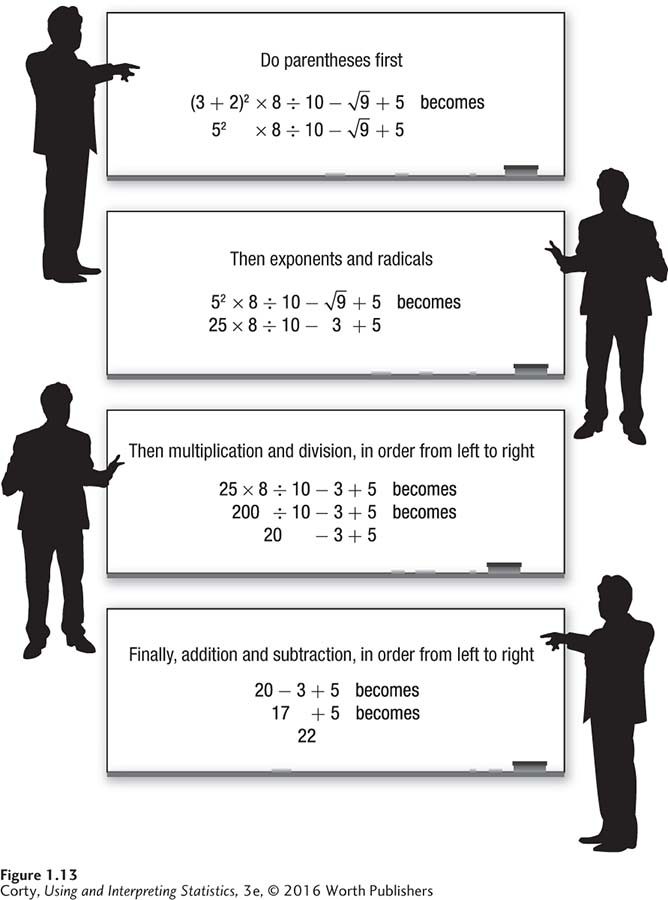
The order of operations tells the order in which math is done. Following the order of operations is important for getting the right answer. Many students remember the acronym PEMDAS from elementary school. PEMDAS stands for parentheses, exponents, multiplication, division, addition, and subtraction. It is the order to be followed in equations. “Please excuse my dear Aunt Sally” is a mnemonic commonly used to remember PEMDAS.
The PEMDAS order of operations means the math within parentheses and brackets is done first, then the exponents (numbers raised to a power like 32 and radicals like  ) are computed. Next, the multiplication and division are calculated in order from left to right. Finally, the addition and subtraction are done, again in order from left to right. A problem like (7 + 3) × 32 ÷ 2 + 3 − 2 × 3 ×
  would be completed as follows:
First the parentheses: (7 + 3) × 32 ÷ 2 + 3 − 2 × 3 ×
= 10 × 32 ÷ 2 + 3 − 2 × 3 × Then the exponents and radicals: 10 × 32 ÷ 2 + 3 − 2 × 3 ×
= 10 × 9 ÷ 2 + 3 − 2 × 3 × 3Then the multiplication and division: 10 × 9 ÷ 2 + 3 − 2 × 3 × 3 = 45 + 3 − 18
Finally, the addition and subtraction: 45 + 3 − 18 = 30
For another example of following the order of operations, see Figure 1.13. Each chalkboard in the figure shows another step in the order of operations.
Keep alert for summation signs in the order of operations. Using the order of operations correctly for the five ages, ΣX2 means 52 + 72 + 102 + 112 + 152, not 482. Also, complete summations before doing other addition and subtraction. For example, with the age data, ΣX + 1 means 48 + 1. It doesn’t mean add 1 to each age and then add them all up. That would be Σ(X + 1).
Rules of Rounding
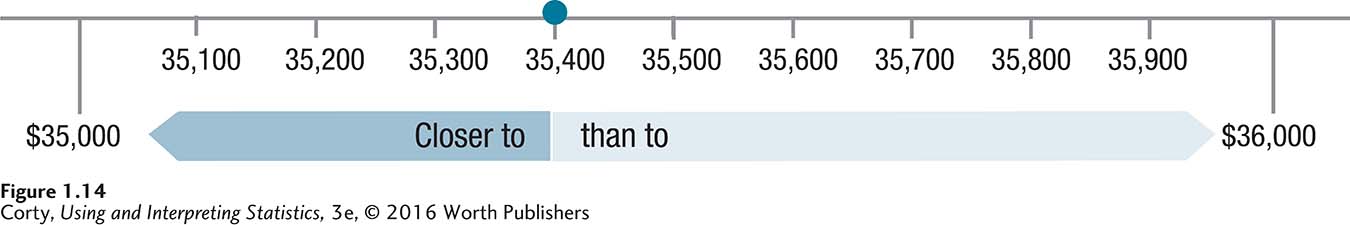
It is important to round correctly in order to obtain the right answer. Rounding involves making a number easier to work with by removing or simplifying digits on the right. A rounded number should accurately reflect the unrounded number. If someone reports her salary of $35,400 as $35,000, that’s rounding. Note that she rounded her salary to $35,000, not $36,000. That’s because $35,000 is a more accurate reflection of the unrounded number than is $36,000. It is a more accurate answer because it is closer to the original value. This is shown on a number line in Figure 1.14.
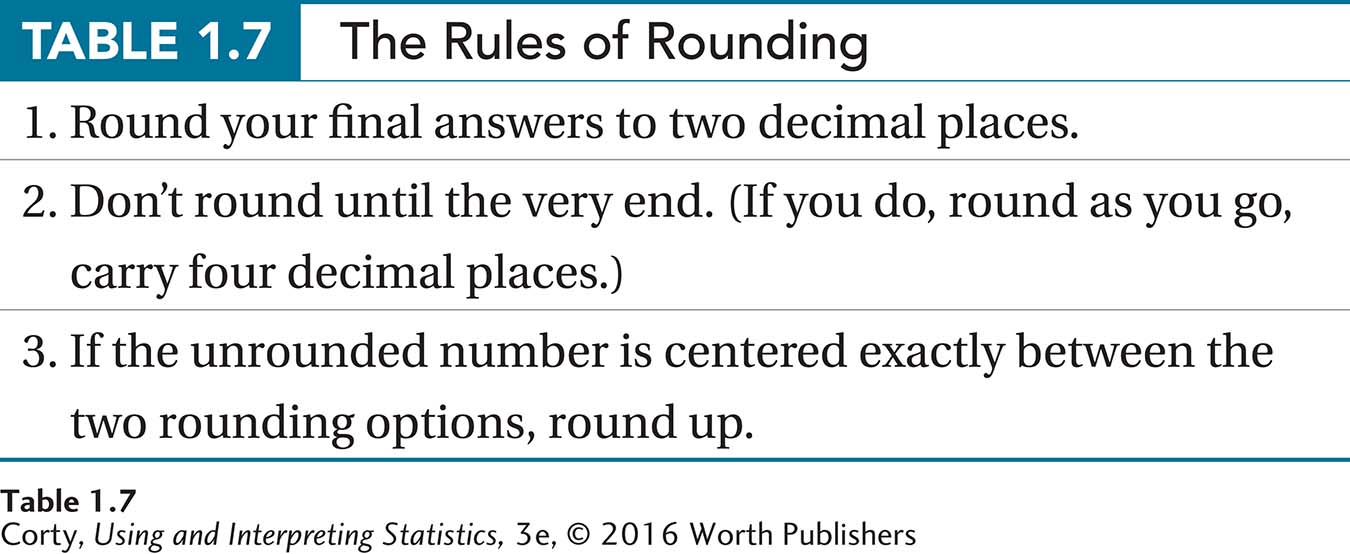
The American Psychological Association recommends reporting results to two decimal places (APA, 2010). So, Rounding Rule 1 is as follows: final answers should be rounded to two decimal places.
Rounding Rule 2 is that numbers shouldn’t be rounded until the very end. Carry as many decimal places as possible through every calculation. Sometimes, though, it is unrealistic to carry all decimal places. If that’s the case, round intermediate steps to four decimal places, which is two more decimal places than the final answer will have. Problems worked in the book will carry four decimal places.
Here’s an example of how not carrying enough decimal places can get one into trouble. Look at this equation and see if, without using a calculator, you can figure out the answer:
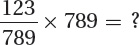
The divisor (789) and the multiplier (789) will cancel each other out and the result should be 123. If one were to violate the second rule of rounding and round the result of the initial division to two decimal places, the final result would be off:
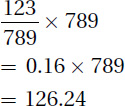
In contrast, if one had rounded the first step to four decimal places, the final answer would have been much closer to what it should have been:
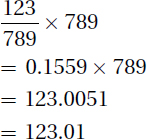
The bottom line: don’t round to two decimal places until the end.
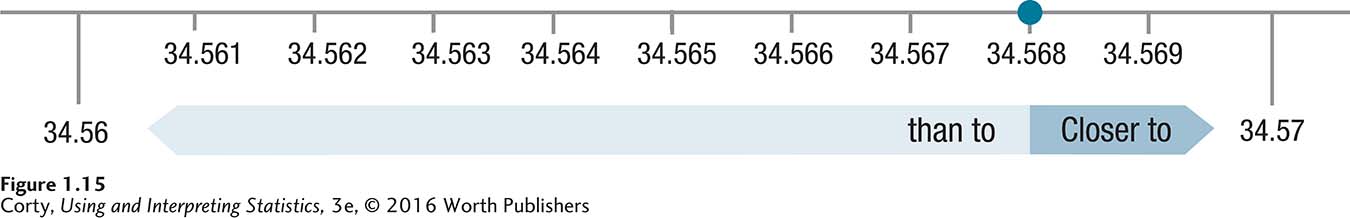
Now that the first two rules of rounding have been stated, here’s how to round a number to two decimal places. For an example, use 34.568:
Start by cutting off the number at two decimal places: 34.56. That’s one option for the rounded number.
Get a second rounding option by adding one unit to the final digit, by going one higher in the hundredths column, to 34.57.
Now it is time to decide which number, 34.56 or 34.57, is closer to the unrounded number. Look at the number line in Figure 1.15. The number 34.56 is 0.008 away from the unrounded number, while 34.57 is only 0.002 away. Because 34.57 is closer to the unrounded number, that is the answer.
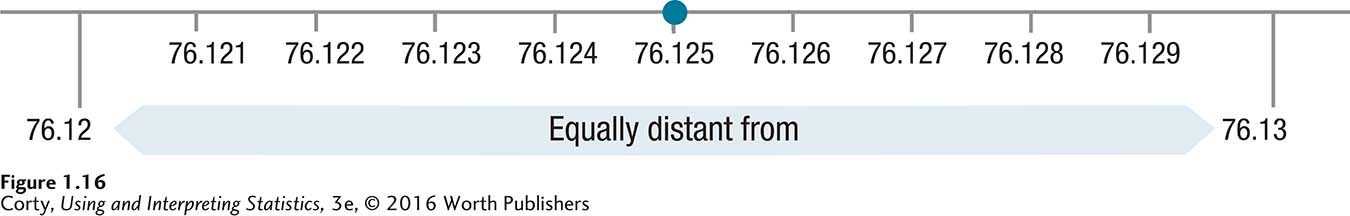
If an unrounded number (e.g., 76.125) is exactly centered between the two options (76.12 and 76.13), then round up. That’s Rounding Rule 3: when the two options for the rounded number are the same distance from the unrounded number, round up. Thus, 76.125 would be rounded to 76.13, as explained in Figure 1.16. The rules of rounding are summarized in Table 1.7.
A Common Question
Q Why aren’t the rules of rounding followed when reporting N, sample size?
A The number of cases, N, is always a whole number. One can’t have 57.8 cases in a study. So, N is always reported without any decimal places.
Worked Example 1.3
As practice for order of operations and rounding, here’s a tougher problem than we’ve encountered so far. By following the order of operations and breaking down the equation into pieces, it is possible to get the right answer. Note that after performing math on a number, follow the rules of rounding and carry four decimal places.
p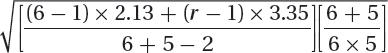
First come parentheses and brackets. Working from the inside out, doing the interior parentheses first and then the bracket on the right, one gets
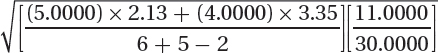
The bracket on the left can’t be attacked until the math inside it is done. Inside a parentheses or bracket, one still has to follow the order of operations, so do the multiplication and division first. Doing the multiplication gives
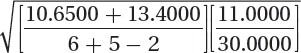
The next step is the addition and subtraction inside the brackets:
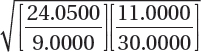
Now do the division within the brackets:
When brackets or parentheses are next to each other, that means multiplication: (3)(2) is the same thing as 3 × 2. So, as the next to last step, do the multiplication:

Exponents were supposed to be completed at the second step in the order of operations. But, the math within the square root sign had to be completed first. So, finally, take the square root of 0.9799 to get 0.9899, which is rounded to 0.99 for the final answer.
DIY
In this do-it-yourself section, you will explore the power of rounding. Get a receipt from a trip to the grocery store, one where a lot of items were purchased. Find the total spent before taxes. Round each item to the nearest dollar. If something cost less than 50 cents, it would round to zero. Now, add up all the rounded numbers. Is the sum of the rounded numbers remarkably close to the sum of the unrounded numbers? Why?
Does this approach still work if you round all items to the nearest $2? (If something costs less than a dollar, round it to zero. From $1.00 to $2.99 rounds to $2; from $3.00 to $4.99 rounds to 4; etc.) How about if you round to the nearest $5? ($0.00 to $2.49 = $0; $2.50 to $7.49 = $5; etc.) What happens as you round more and more?
Save the receipt because you will need it again in Chapter 3.
Practice Problems 1.5
Review Your Knowledge
1.21 What abbreviation do statisticians use for a summation sign?
1.22 Following the order of operations, what does one do first in an equation?
1.23 According to the American Psychological Association, how many decimal places should a result have?
Apply Your Knowledge
1.24 Given this data set (12, 8, 4, 6), calculate what is requested. Don’t forget the rules of rounding.
N
ΣX
ΣX2
(ΣX)2
ΣX + 1
Σ (X +1)
1.25 Round the following appropriately:
17.7854
9.7432
12.9845
8.3450
7.1205


Application Demonstration
Here’s a study about memory that reviews everything from Chapter 1. Two researchers investigated “use it or lose it” in relation to mental ability. They studied whether people lose mental ability if they don’t keep using their minds as they age (Rohwedder & Willis, 2010).
The researchers used data from men and women who were 60 to 64 years old and from 13 countries (the United States and 12 European nations). The men and women had taken a recall test in which they were read a list of 10 words and then asked to recall as many as they could. Five minutes later, the participants were again asked to recall the words. The test was scored as the total number of words recalled in both conditions (the immediate and the delayed). So, memory scores could range from 0 to 20, with higher scores indicating better recall. It is important to know that the researchers consider this memory score to be a measure of cognitive functioning, not just a count of the number of words recalled.
The cases in this study are countries, so there were 13 scores, each one being the average score for a sample of men and women in that country. Each country also provided a second score. The men and women in the countries were also asked if they were working for pay. The percentage of the 60- to 64-year-olds not working for pay was calculated for each country. It ranged from about 40% in Sweden to more than 90% in Austria.
The researchers figured that people who were not working for pay were retired and less likely to use their minds in the way that people do at work. They examined the relationship between the percentage of respondents not working for pay and the average recall score and found a relationship—the higher the percentage of people not working for pay, the lower the cognitive functioning score. This suggests that if people don’t use it, they do lose it. That’s why the researchers called their paper “Mental Retirement.”
Levels of Measurement
First, what are the levels of measurement for the variables in the study? The two variables were cognitive function, as measured by the recall task, and the percentage of people not working. On the recall task, scores can range from 0 to 20. To figure out level of measurement, make up two scores—country A has an average score of 10 and country B a 12. The scores tell same/different, as one can tell that the average cognitive functioning is not the same in the two countries, so the score is at least nominal. One can also tell the direction of the difference, that country B has better average cognitive function than country A, so the score is at least ordinal. There is equality of units—each word recalled correctly is worth the same number of points—so one can tell the size of the difference—citizens of country B recall an average of two more words than citizens of country A—so the measure is at least interval. Now for the absolute zero point question: Does a zero on the scale mean an absence of cognitive functioning? A zero means that the participant recalled no words, which is different from an absence of cognitive functioning. So, there is not an absolute zero point. The answer to the absolute zero point question is a no, so the cognitive functioning score is measured at the interval level.
For the second variable, the percentage of people not working, make up two scores again—country C has a 40 and country D an 80. These two countries have different percentages of 60- to 64-year-olds not working, so the variable is at least nominal. The scores tell the direction of the difference, which country has a higher percentage not working, so the variable is at least ordinal. As percentages have equality of units, one can meaningfully speak of the 40-point distance between the two countries. As one can tell the size of the difference, the variable is at least interval. Finally, percentages have an absolute zero point, so one can form a ratio and say that country D has twice the percentage of people not working as country C; thus, the variable is measured at the ratio level.
Explanatory Variable and Outcome Variable
Which of the two variables is the explanatory variable and which is the outcome variable? The researchers seem to believe that not working, being retired, causes a loss of cognitive functioning, so the percentage of people not working is the explanatory variable and cognitive functioning is the outcome variable. Another way to think about this is to look at chronological order: the explanatory variable, retirement, happens before the outcome variable, cognitive function, is measured. People were working or not working before their recall was measured.
Type of Study
What type of design have the researchers used for their study? Using the flowchart in Figure 1.5, the decision moves down the path of the explanatory variable not having been controlled by the researchers. After all, the researchers didn’t assign some countries to retire workers at an earlier age and others to retire them at a later age. Next, decide whether the explanatory variable was used to classify cases into groups. It wasn’t, so the study used a correlational design. Correlational studies have specific names for the explanatory and outcome variables. Percentage of people not working is the predictor variable and cognitive function is the criterion variable.
Because the study is a correlational design, one can’t conclude that retirement is the cause of lower cognitive function. (Remember, correlation is not causation.) Retirement might cause lower cognitive functioning, but the cause also might run the other way. Perhaps people decide to retire because they have declined cognitively. Also, one has to consider the possibility of confounding variables, third variables that affect both retirement and cognitive function. The economy might be a plausible confounding variable—the overall unemployment rate could affect both the percentage of 60- to 64-year-olds who are working and people’s mental state. Similarly, the quality of health care in the countries could be a confounding variable—poorer health care could lead to earlier retirement and poorer cognitive function.
The Language of Statistics
Did the researchers use a sample or a population in their study? The countries studied were the United States and 12 European nations, but there are more nations in North America than just the United States and there are more than 12 nations in the European Union. The study didn’t consist of every North American and European nation, so it used a sample.
Are the results meant to be descriptive or inferential? Do the researchers’ findings describe the relationship between percentage retired and cognitive function for those 13 nations only? Or, do the researchers want to draw a general conclusion about the relationship between these two variables? It seems reasonable that they want the readers of their study to draw a conclusion that goes beyond these 13 nations. The researchers probably mean to suggest, for humans of all nations, that a relationship exists between these two variables. As they indicate the results to be generalized beyond the few cases in the sample, the researchers mean the results to be inferential, not descriptive.