4.1 Standard Scores (z Scores)
People often say that you cannot compare apples and oranges. In this chapter, we’ll see this can be done thanks to something called a standard score. We’ll also see that standard scores allow one to quantify how common or how rare a score is.
Imagine that two fruit growers, Anne who grows apples and Oliver who grows oranges, get into a good-natured argument over whose fruit is better. Anne claims that the crispiness of apples is what makes them so good. Oliver cites the juiciness of oranges as their best feature. How can one objectively compare the crispiness of an apple to the juiciness of an orange to decide which fruit has more of its desired quality? Standard scores.
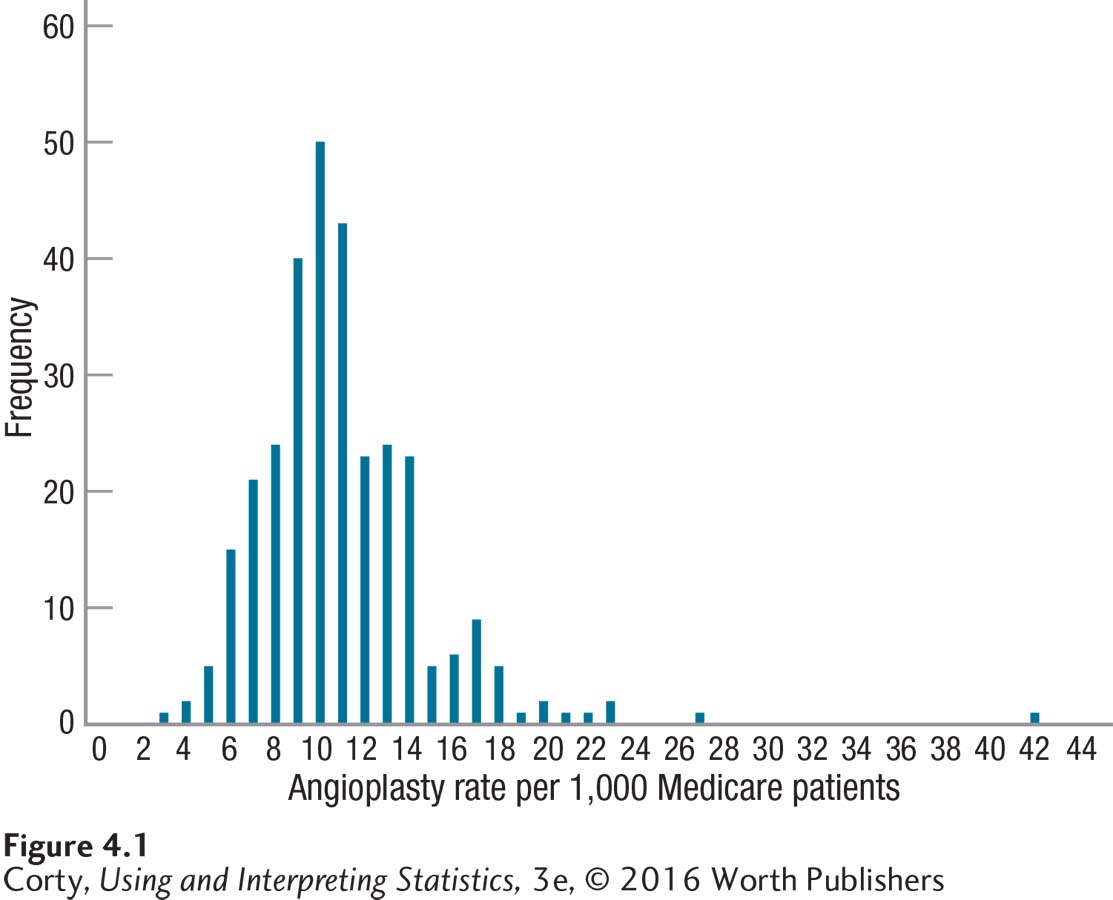
Look at the graph in Figure 4.1. It shows the rate with which Medicare patients receive angioplasty in different geographic hospital regions of the United States. It should be apparent that most hospitals cluster around rates of 6 per thousand patients to 14 per thousand patients. And then, there is one city, way off by itself on the right-hand side, treating an unusually large percentage of Medicare patients with angioplasty. How can we describe how unusual that city is? Standard scores.
A standard score is a raw score expressed in terms of how many standard deviations it is away from the mean. Standard scores are commonly called z scores. The formula for calculating a z score is shown in Equations 4.1 and 4.2.
Equation 4.1 Formula for Calculating Standard Scores (z Scores) for a Population

where z = the standard score
X = the raw score
μ = the population mean
σ = the population standard deviation
Equation 4.1 is used when the population mean, μ, and population standard deviation, σ, are known. As it is relatively rare that they are known, Equation 4.2 is more commonly used.
Equation 4.2 Formula for Calculating Standard Scores (z Scores) for a Sample
where z = the standard score
X = the raw score
M = the population mean
s = the sample standard deviation
Each of these two formulas has two steps:
Step 1 Subtract the mean from the raw score, just as was done in Chapter 3 when calculating deviation scores. Be sure to keep track of the sign, whether the deviation score is positive, negative, or zero.
Step 2 Divide the deviation score by the standard deviation and round to two decimal places. Again, be sure to keep track of the sign, whether the z score is positive, negative, or zero.
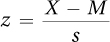
Chapter 3 introduced a sample of five Americans where the mean height, in inches, was 67.00 and the standard deviation was 4.18. One of the members of this sample was 62″ tall. For this person, one would calculate the standard score like this:
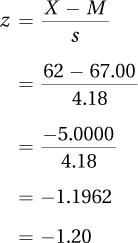
This person’s z score was –1.20, meaning that his or her score fell 1.20 standard deviations below the mean. The scores for all five members of the sample, as z scores, are shown in Table 4.1.
There are two things to note in this table:
The z scores quickly show where a person’s score falls in relation to the mean. As shown in Figure 4.2, positive z scores indicate a score above the mean, negative z scores a score below the mean, and a z score of 0 is a score right at the mean.
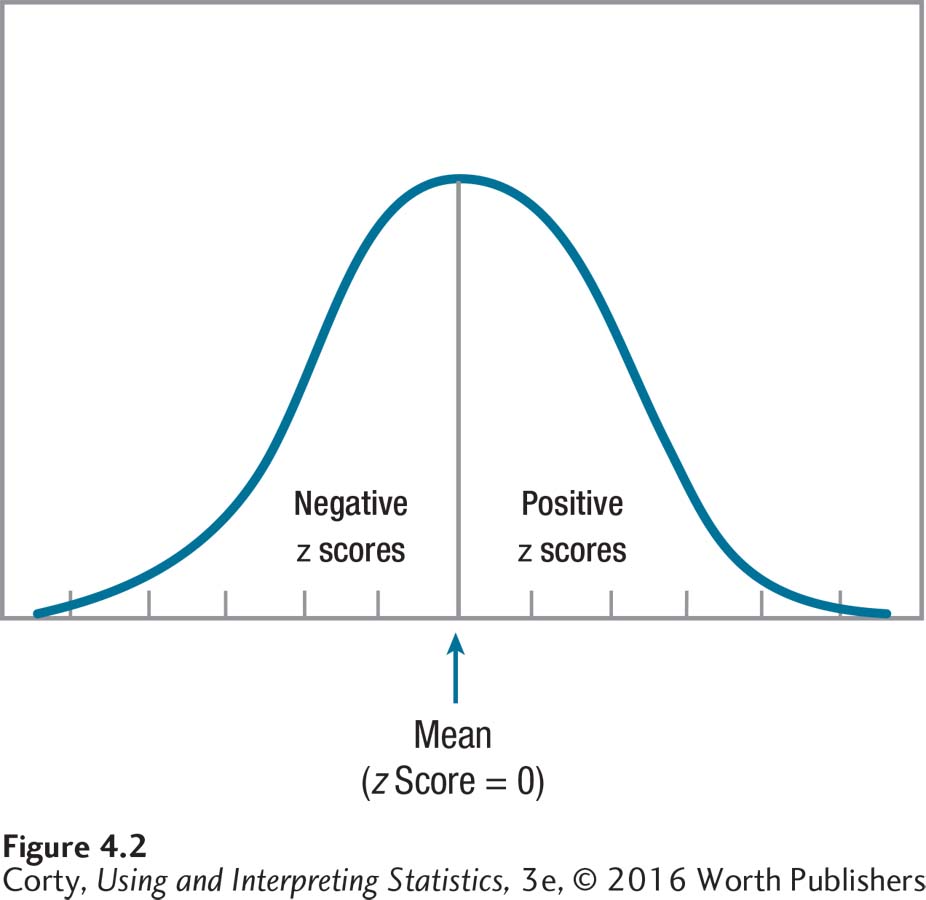 Figure 2.3 Figure 4.2 Positive, Negative, and Zero z Scores Another term for standard score is z score. A positive value for a z score means that the score falls above the mean, a negative value means that the score falls below the mean, and a value of 0 means that the score falls right at the mean.
If the z scores for a data set are added together, they sum to zero.
z scores standardize scores. They transform scores to a common unit of measurement, the standard deviation. This allows researchers to compare variables that are measuring different things on different scales.
The same information found in z scores is contained in the regular deviation scores that are shown in the middle column of Table 4.1. So, what is the advantage of z scores? z scores standardize scores. They transform scores to a common unit of measurement, the standard deviation. This allows researchers to compare variables that are measuring different things on different scales.
For example, consider Carlos, who is very smart and very extroverted. Which does Carlos have more of, intelligence or extroversion? To answer this question, Carlos takes two tests. One is an intelligence test and the other is an extroversion scale. Carlos gets a score of 130 on the IQ test and a 75 on the extroversion scale. Do these two scores answer the question of whether Carlos is more unusual in terms of his intelligence or his extroversion?
These scores are out of context, so the question can’t be answered. Knowing the means will help put the scores in context. The mean for the intelligence test is 100, and the mean for the extroversion scale is 50. With the means, one can tell that Carlos is above average in terms of intelligence and in terms of extroversion. The next step is to calculate the deviation scores to see how far above average he is. Carlos’s deviation score for intelligence is 130 – 100 = 30.00. For extroversion, his deviation score is 75 – 50 = 25.00. Based on the deviation scores, it seems as if Carlos is more unusual in terms of intelligence than he is in terms of extroversion. After all, he scored 30 points above the mean on intelligence, but only 25 points above the mean on extroversion. But that would be a premature conclusion. A true comparison can’t be made until standard deviation information is considered and z scores are calculated.
Here are the standard deviations: 15 for the IQ test and 10 for the extroversion scale. Now, Equation 4.2 can be used to calculate z scores:
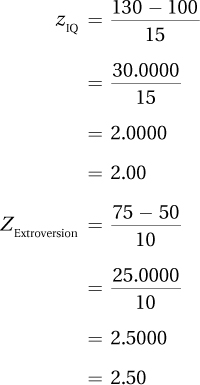
Now the question can be answered using a standard unit, the amount of variability in a set of scores in terms of standard deviation units. Carlos’s intelligence test score falls 2 standard deviations above the mean, but his extroversion score falls 2.5 standard deviations above the mean. As shown in Figure 4.3, Carlos deviates more from the mean in terms of extroversion than he does in terms of intelligence. His level of extroversion is more unusual than his level of intelligence.
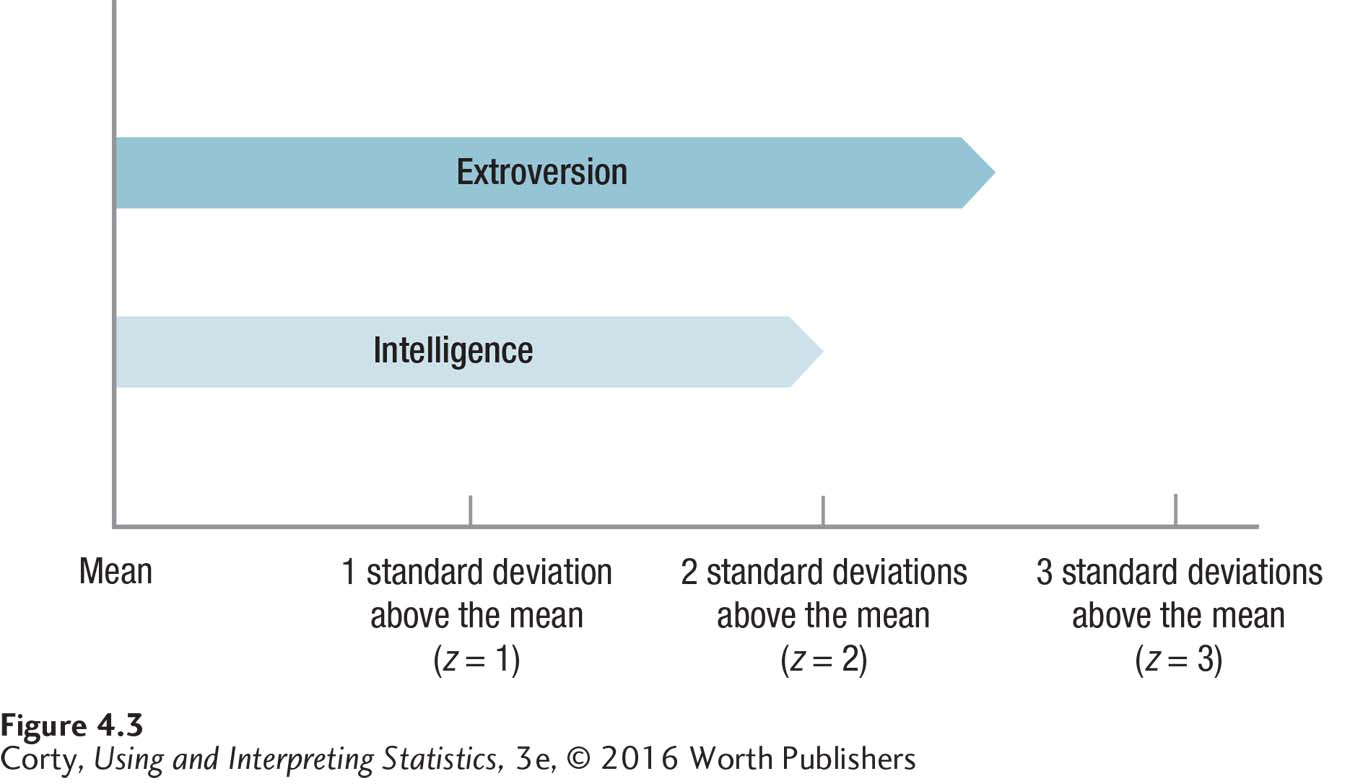
With the z scores, two different variables measured on two different scales can be compared in a statement like this, “Carlos is more above average in his level of extroversion than he is in his level of intelligence.” The comparison can be made because the scores have been standardized.
In the same way, the apple and orange example from the start of the chapter would work. If there were a juiciness scale, Oliver’s orange could be measured. And, with a crispiness scale, Anne’s apple could be measured. Then, each measurement would be converted to a standard score and the one with the higher score would be the winner.
Just as raw scores can be turned into standard scores, it is possible to reverse direction and turn z scores into raw scores. Suppose Mei-Li was also extroverted and that her z score was 1.00 on the extroversion scale. What was her raw score?
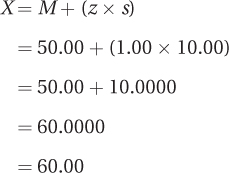
Here’s what to do. A z score of 1.00 is a positive score, which indicates that her score was above the mean. The mean on the extroversion scale is 50.00, so her score will be greater than this. A z score of 1.00 says that Mei-Li’s score was 1 standard deviation above the mean. A standard deviation on the extroversion scale is 10.00, so her score was 10 points above the mean. Adding 10.00 (1 standard deviation) to 50.00 (the mean) leads to the conclusion that Mei-Li’s score on the test was 60.00. Equation 4.3 formalizes how to turn z scores into raw scores.
Equation 4.3 Formula for Calculating a Raw Score (X) from a Standard Score (z)
X = M + (z × s)
where X = the raw score
M = the mean
z = the standard score for which the raw score is being calculated
s = the standard deviation
Following this formula, here is how to calculate Mei-Li’s score:
Here’s one more example of converting a z score into a raw score, this one with a negative z score. Suppose that Tabitha’s z score on the IQ test was –0.75. What was her raw score? Using Equation 4.3, here are the calculations:
X = 100.00 + (–0.75 × 15.00)
= 100.00 + (–11.2500)
= 100.00 – 11.2500
= 88.7500
= 88.75
On the IQ test, Tabitha’s score was 88.75. Note that the raw score is reported to two decimal places and does not have to be a whole number.
Worked Example 4.1
SAT subtests are handy for practice in converting from raw scores to z scores and vice versa. As of March 2016, there are two parts on the SAT: a subtest that measures math, and a subtest that measures reading and writing. Both subtests are scored on the same scale, where 500 is the average (mean) score and the standard deviation is 100. Suppose a high school senior takes the SAT and gets a 460 on the reading and writing subtest. What is her score as a standard score?
Applying Equation 4.2, here are the calculations:
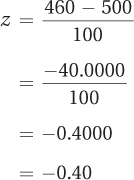
She scored 0.40 standard deviations below the mean, so her z score would be reported as –0.40.
Suppose she had a friend who took the SAT and did very well on the math section. Her friend’s score on the math section, expressed as a z score, was 1.80. What was her friend’s score?
Applying Equation 4.3, here are the calculations:
X = 500 + (1.80 × 100)
= 500 + 180.0000
= 680.0000
= 680.00
This student, who had scored 1.80 standard deviations above the mean, obtained a score of 680.00 on the math subtest of the SAT.
Practice Problems 4.1
Review Your Knowledge
4.01 In what units do z scores express raw scores?
4.02 What is the sum of all z scores in a data set?
4.03 If a z score is positive, what does that mean?
Apply Your Knowledge
4.04 The average GPA in a class is 2.75 with a standard deviation of 0.40. One student has a GPA of 3.20. Express this GPA as a z score?
4.05 Another student’s GPA, expressed as a z score, is –2.30. What is his GPA?