STEP-BY-STEP TECHNOLOGY GUIDE: The χ2 Goodness of Fit Test
We illustrate the use of technology, once the observed and expected frequencies are known, for Example 5 (page 639).
TI-84
- Step 1 Enter observed frequencies in list L1 and expected frequencies in list L2.
Step 2 Press STAT, highlight TESTS, select χ2 GOF-Test, and press ENTER (Figure 8).
FIGURE 8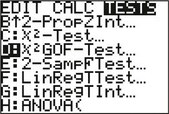 Page 642
- Step 3 For Observed enter L1, and for Expected enter L2. For df, enter degrees of freedom 3 (Figure 9).
- Step 4 Highlight Calculate and press ENTER. The results are shown in Figure 6 in Example 5, and include χ2data data and the p-value.
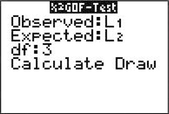 FIGURE 9
TI-83/84
To find χ2data:
- Step 1 Enter observed frequencies in list L1 and expected frequencies in list L2. Press 2nd QUIT.
- Step 2 Press 2nd LIST, highlight MATH, select 5: sum(, and press ENTER (Figure 10).
- Step 3 Type the following: (L1–L2)^2/L2) (see Figure 5 in Example 5) and press ENTER.
- Step 4 The TI-83/84 then displays 4.16 as χ2data (see Figure 5 in Example 5).
To find the p-value:
Step 1 Select 2nd DISTR, then 8: χ2 cdf(, and press ENTER.
 FIGURE 10
- Step 2 To get the p-value, that is, the area to the right of 4.16, enter (4.16, comma, 1E99, comma, 3), as shown in Figure 5 in Example 5. Press ENTER.
EXCEL
To find χ2data:
- Step 1 Enter the observed and expected frequencies in rows 1 and 2 (Figure 11).
- Step 2 In cell B3, enter: =(B1-B2)^2/B2 (Figure 11) and press ENTER.
- Step 3 Copy the contents of cell B3 to cells C3 through E3.
- Step 4 Select an empty cell, enter =SUM(B3:E3), and press ENTER. Excel then displays the value χ2data = 4.16 (Figure 12).
To find the p-value:
- Step 1 Select a cell and enter =CHITEST(B1:E1,B2:E2) and press ENTER.
- Step 2 Excel then provides the p-value (Figure 13).
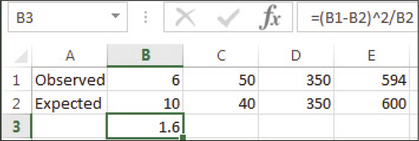 FIGURE 11
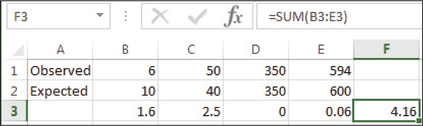 FIGURE 12
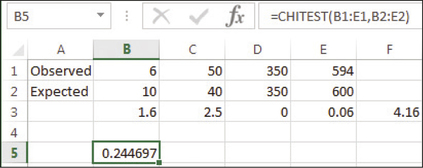 FIGURE 13
MINITAB
To find χ2data:
- Step 1 Enter the observed frequencies into C1 and the hypothesized proportions into C2.
- Step 2 Click Stat > Tables > Chi-Square Goodness of Fit Test (One Variable).
- Step 3 For Observed counts, enter C1.
- Step 4 Click Specific Proportions and enter C2 in box.
- Step 5 Click OK. Graphs are generated as well as session window output.
SPSS
- Step 1 Enter a numeric code for the type of violent crime in the first column, for example, 1 for Murder and so on. Enter the observed frequencies in the second column.
- Step 2 Click Data > Weight Cases…. Select Weight cases by, and move the second column to the Frequency Variable box. Click OK.
Step 3 Click Analyze > Nonparametric Tests > Legacy Dialogs > Chi-square…
Move the first column to the Test Variable List box.
Step 4 Select Values from the Expected Values box, and enter the expected proportions of the categories in order of their numeric code (0.01 for Murder first, and so on). Click OK.
Page 643- Step 5 The test statistic (Chi-Square) and its p-value (Asymp. Sig.) are in the Test Statistics box in the output shown in Figure 7b of Example 5.
JMP
- Step 1 Click File > New > Data Table. Enter the type of violent crime in Column 1, and the observed frequency in Column 2.
- Step 2 Click Analyze > Distribution. Move Column 1 to the Y, Columns box, and Column 2 to the Freq box. Click OK.
- Step 3 Click the red triangle beside Column 1, and select Test Probabilities.
- Step 4 Under Hypoth Prob, enter the hypothesized probabilities for each category. The categories are listed in alphabetical order, not necessarily the order they appear in Column 1.
- Step 5 Select Fix hypothesized values, rescale omitted. Click Done.
- Step 6 The test statistic and its p-value are in the Pearson row of the output, shown in Figure 14.
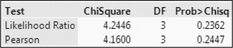 FIGURE 14 SPSS output.
CRUNCHIT!
To find χ2data and the p-value:
- Step 1 Put the observed frequencies in Var1 and the hypothesized probabilities in Var2.
- Step 2 Click Statistics > Chi-squared Goodness of Fit. Select Var1 for Observed Frequencies and Var2 for Expected Probabilities (optional). Click Calculate.
- Step 3 The output is shown in Figure 15.
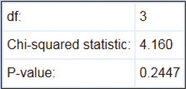 FIGURE 15 CrunchIt! output.
[Leave] [Close]