Section 12.3 Exercises
CLARIFYING THE CONCEPTS
Question 12.97
1. Explain the difference between the variable of interest and the blocking factor. What is another term for the variable of interest? For the blocking factor? (p. 694)
12.3.1
The variable of interest is the variable we are interested in studying, and the blocking factor is a variable that is not of primary interest to the researcher but is included in the ANOVA in order to improve the ability of the ANOVA to find significant differences among the treatment means. Treatment. Nuisance factor.
Question 12.98
2. What do we do in a randomized block design ANOVA? (p. 694)
Question 12.99
3. Explain why a large SSE is bad if we want to reject the null hypothesis in ANOVA. (p. 697)
12.3.3
We reject when the is small. The smaller SSE is, the larger is and therefore the smaller the is.
Question 12.100
4. Explain how a larger statistic leads to a more likely rejection of the null hypothesis in ANOVA. (p. 697)
PRACTICING THE TECHNIQUES
 CHECK IT OUT!
| To do | Check out | Topic |
|---|---|---|
| Exercises 5–10 | Example 11 | Randomized block design (RBD) |
| Exercises 11–13 | Example 12 | Demonstrating how RBD works |
For Exercises 5–8, use the indicated randomized block design ANOVA output to test, using level of significance , whether the treatment means differ.
- Provide the hypotheses and the rejection rule.
- Find the relevant -value; provide the conclusion and the interpretation.
Question 12.101
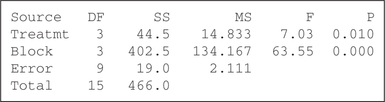
5.
12.3.5
(a) : Not all of the population means are equal. Reject if . (b) The , which is ; therefore we reject . There is evidence at level of significance that the population means are not all equal.
Question 12.102
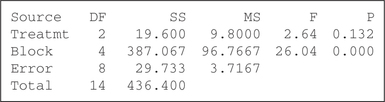
6.
Question 12.103
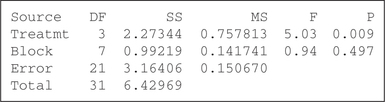
7.
12.3.7
(a) : Not all of the population means are equal. Reject if . (b) The , which is ; therefore we reject . There is evidence at level of significance that the population means are not all equal.
Question 12.104
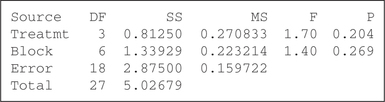
8.
For Exercises 9 and 10, for the indicated partially completed randomized block ANOVA table, do the following:
700
- Provide the hypotheses.
- Complete the missing entries in the table.
- Use technology to find the -value. For level of significance , provide the conclusion and the interpretation.
Question 12.105
9.
| Source | Sum of square |
Degrees of freedom |
Mean squares |
|
|---|---|---|---|---|
| Treatments | 90 | — | 45 | — |
| Blocks | 50 | — | — | |
| Error | — | 8 | 7.5 | |
| Total | — | 15 |
12.3.9
(a) : Not all of the population means are equal. Reject if . (b) Answers to missing values are in red.
| Source | Sum of squares |
Degrees of freedom |
Mean square |
|
|---|---|---|---|---|
| Treatments | 90 | 2 | 45 | 6 |
| Blocks | 50 | 5 | 10 | |
| Error | 60 | 8 | 7.5 | |
| Total | 200 | 15 |
(c) The , which is ; therefore we reject . There is evidence at level of significance that the population means are not all equal.
Question 12.106
10.
| Source | Sum of square |
Degrees of freedom |
Mean squares |
|
|---|---|---|---|---|
| Treatments | — | 3 | — | — |
| Blocks | — | 6 | 40 | |
| Error | 216 | — | — | |
| Total | 636 | — |
For Exercises 11 and 12, do the following:
- Reconstruct the corresponding one-way ANOVA table.
- Perform the one-way ANOVA using level of significance . Provide the hypotheses, the conclusion, and the interpretation.
- Is the conclusion from the one-way ANOVA different from that of the RBD analysis? Did the RBD help to find significance?
Question 12.107
11. The randomized block design ANOVA table in Exercise 9
12.3.11
(a)
| Source | Sum of squares |
Degrees of freedom |
Mean square |
|
|---|---|---|---|---|
| Treatments | 90 | 2 | 45 | 5.3182 |
| Error | 110 | 13 | 8.4615 | |
| Total | 200 | 15 |
(b) : Not all of the population means are equal. Reject if . The , which is ; therefore we reject . There is evidence at level of significance that the population means are not all equal. (c) The conclusions are the same for both tests. No.
Question 12.108
12. The randomized block design ANOVA table in Exercise 10
Question 12.109
13. Verify that, in general, equals the sum of and . (Hint: .)
12.3.13
APPLYING THE CONCEPTS
Question 12.110
veggieprices
14. Vegetable Prices. Is there a difference in the mean price of vegetables from year to year? The table contains the price per pound (in dollars) for six different vegetables in June 2012, June 2013, and June 2014. Test, using the randomized block design at level of significance , whether the population mean price is the same for all three years.
| 2012 | 2013 | 2014 | |
|---|---|---|---|
| Beans | 1.44 | 1.40 | 1.48 |
| Broccoli | 1.68 | 1.73 | 1.77 |
| Lettuce | 0.90 | 0.93 | 1.12 |
| Sweet Peppers | 2.45 | 2.17 | 2.59 |
| Potatoes | 0.68 | 0.65 | 0.69 |
| Tomatoes | 1.49 | 1.47 | 1.68 |
Question 12.111
worldmath
15. Eighth-Grade Math Scores Worldwide. Have worldwide eighth-grade math scores been changing? The table contains the TIMMS average math score for eighth-graders in five countries, for the years 1995, 2007, and 2011. Test, using the randomized block design at level of significance , whether the population mean math score differs across the three years.
| 1995 | 2007 | 2011 | |
|---|---|---|---|
| Singapore | 609 | 593 | 611 |
| Japan | 581 | 570 | 570 |
| Russia | 524 | 512 | 539 |
| USA | 492 | 508 | 509 |
| Sweden | 540 | 491 | 484 |
12.3.15
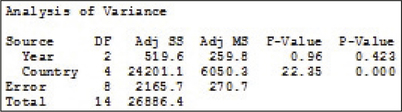
: Not all the population means are equal. Reject if the .
.
.
The is not . Therefore we do not reject . There is not enough evidence to conclude at level of significance that not all of the population mean math scores are the same for all three years.
Question 12.112
healthinschildren
16. Health Insurance: Children Not Covered. The following table contains the number of children under 18 who are not covered by health insurance, for a sample of six states, for the years 2010, 2011, and 2012 (in thousands). Test, using the randomized block design at level of significance , whether the population mean number of children not covered by health insurance is the same for all three years.
| 2010 | 2011 | 2012 | |
|---|---|---|---|
| Alabama | 103 | 86 | 94 |
| Florida | 566 | 516 | 527 |
| Georgia | 249 | 278 | 321 |
| Michigan | 122 | 123 | 78 |
| New York | 352 | 284 | 240 |
| Virginia | 157 | 111 | 108 |
Question 12.113
17. Vegetable Prices. Refer to Exercise 14.
- Test whether the population mean price is the same for all three years, using a one-way ANOVA and level of significance .
- Compare your conclusions in Exercises 14 and 17(a). Did the randomized block design help us to find significance?
12.3.17
(a)
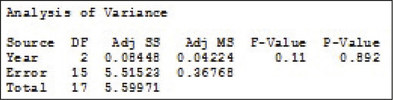
: Not all the population means are equal. Reject if the .
.
.
The is not . Therefore we do not reject . There is not enough evidence to conclude at level of significance that not all of the population mean prices of the vegetables are the same for all three years.
(b) Yes.
Question 12.114
18. Eighth-Grade Math Scores Worldwide. Refer to Exercise 15.
- Test whether the population mean math score differs across the three years, using a one-way ANOVA and level of significance .
- Compare your conclusions in Exercises 15 and 18(a). Did the randomized block design help us to reject the null hypothesis?
Question 12.115
19. Health Insurance: Children Not Covered. Refer to Exercise 16.
- Test whether the population mean number of children without health insurance is the same for all three years, using a one-way ANOVA and level of significance .
- Compare your conclusions in Exercises 16 and 19(a). Did the randomized block design help us to find significance?
12.3.19
(a)
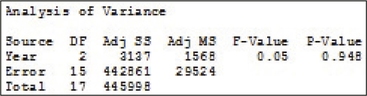
: Not all the population means are equal. Reject if the .
.
.
The p-value = 948 is not . Therefore we do not reject . There is not enough evidence to conclude at level of significance that not all of the population mean number of children not covered by health insurance are the same for all three years.
(b) No.
701
Question 12.116
businessvalue
20. Measures of Business Value. The following table contains three measures of the value of a business: the market capitalization, the firm value, and the business enterprise value (in millions of dollars).
- Use one-way ANOVA to test, at level of significance , whether the population mean values differ among the three measures.
- Notice how much some of the larger firms (like Caterpillar) differ from some of the smaller firms (like Abercrombie & Fitch) for all three measures. This indicates that there is variability among the firms. Let us account for this variability by using the firms as blocks and testing, using the randomized block design at level of significance , whether the population mean values differ among the three measures.
- Did accounting for the variability among the firms help us to find significant differences among the three measures of firm value?
| Market cap |
Firm value |
Enterprise value |
|
|---|---|---|---|
| Abercrombie & Fitch | 3.1 | 3.2 | 2.7 |
| Caterpillar | 36.3 | 71.9 | 69.1 |
| CIGNA | 10.0 | 12.1 | 10.7 |
| Delta Air Lines | 9.2 | 25.8 | 21.3 |
| Nissan Motors | 38.2 | 90.0 | 82.4 |
| Repsol Petroleum | 32.6 | 50.2 | 45.5 |