1.2 An Introduction to Statistics
 This page includes Video Technology Manuals
 This page includes Statistical Videos
OBJECTIVES By the end of this section, I will be able to …
- Describe the field of statistics, and state the meaning of the term descriptive statistics.
- Explain what elements, variables, and observations are.
- Describe the difference between qualitative and quantitative variables, and between discrete and continuous variables.
- State the four levels of measurement.
- Describe what is meant by a population, a sample, a parameter, and a statistic, and explain statistical inference.
1 What is Statistics?
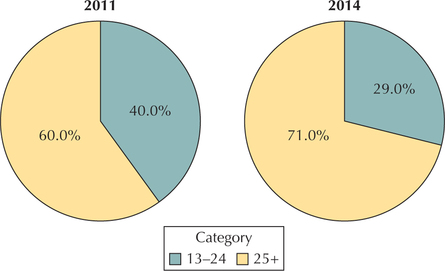
Is Facebook not cool anymore? Figure 3 shows that the percentage of Facebook users that are 13–24 years old has decreased from 40% to 29% in just three years: 2011 to 2014. This reflects a loss of 6 million Facebook users from the 13–24 age group (Source: Facebook Social Ads Platform, 2014). These numbers are examples of statistics—numbers that describe a group of people or things. Think about these numbers. Here are some questions we could ask about this survey:
- How did the researchers arrive at these figures?
- Are the figures accurate? Could they be inaccurate?
- The research found that fewer young people were on Facebook in 2014 than in 2011. But is this difference meaningful or just a product of random chance?
These are some of the types of questions we will be investigating throughout this book.
Examples of statistics include the following.
- Miguel Cabrera led Major League Baseball in 2013 with a batting average of .348.
- The Gallup polling organization reports that the average amount spent by Americans on a daily basis (not counting monthly bills or mortgage) in August 2014 is $98.
- The Centers for Disease Control report that 17% of American children and adolescents are obese.
- “Three out of four dentists surveyed recommend sugarless gum for their patients who chew gum.”
You may have noticed that the section title, “What Is Statistics?” refers to statistics in the singular. Why? Because the field of statistics involves much more than just collecting and reporting numerical facts. The field of statistics may be defined as follows.
The field of statistics is the art and science of
- collecting data
- analyzing data
- presenting data
- interpreting data
A statistician, then, is someone trained in the art and science of statistics. You may be surprised at the inclusion of the word art in the definition of statistics. But there is no question that judgment, experience, and even a little intuition are indispensable tools for any statistician's portfolio.
For today's college student, the field of statistics is especially relevant and useful. For example,
- A nursing major may want to learn whether or not homeopathic medicine really works.
- A business major may be interested in whether she should consider diversifying her portfolio to tech stocks, based on their price/earnings ratios.
- A psychology major may be interested in determining whether differences in therapeutic outcomes exist between traditional counseling methods and a new cognitive approach.
- An education major may be interested in whether listening to a Mozart sonata before taking an exam can significantly improve his grade.
The field of statistics can help solve each of these puzzles.
The following example is a classic illustration of how statistics represents the art and science of (1) collecting, (2) analyzing, (3) presenting, and (4) interpreting data.
EXAMPLE 4 The four phases of statistics: Does Friday the 13th change human behavior?
Superstitions affect most of us. Some people will never walk under a ladder, whereas others will alter their path to avoid a black cat. Do you think that people change their behavior on Friday the 13th? Perhaps, suspecting that it may be unlucky, some people might elect to stay home and watch television instead of venturing outdoors or driving on the highway. How would researchers go about studying whether superstitions change the way people behave? What kind of evidence would support the hypothesis that Friday the 13th causes a change in human behavior? T. J. Scanlon and his co-researchers thought that if fewer vehicles were on the road on Friday the 13th than on the previous Friday, this would be evidence that some people were playing it safe on Friday the 13th and staying off the roads.1 Note that the researchers didn't simply argue about the validity of the Friday the 13th superstition. Such discussions are interesting but largely subjective. What they deemed important is the effect of such a superstition on human behavior and how to measure such an effect as a change in behavior.

- Phase 1 Data collection. The first phase of a statistical study, as in the definition of statistics, is to collect the data. The researchers obtained data kept by the British Department of Transport on the traffic flow through certain junctions of the M25 motorway in England.
- Phase 2 Data analysis. Next is the analysis of the data. The authors compared the number of vehicles passing through certain junctions on the M25 motorway on Friday the 13th and the previous Friday.Table 1.2: Table 2 Traffic through M25 junctions
Friday the 6th Friday the 13th Difference 139,246 138,548 698 134,012 132,908 1104 137,055 136,018 1037 133,732 131,843 1889 123,552 121,641 1911 121,139 118,723 2416 128,293 125,532 2761 124,631 120,249 4382 124,609 122,770 1839 117,584 117,263 321 fridaythe13th
Table 2 shows that, in every instance, the number of vehicles passing through these junctions on Friday the 13th was less than on the preceding Friday. Now, let's examine the data graphically. The clustered bar graph in Figure 4 illustrates the difference in the number of vehicles traveling on the M25 motorway on Friday the 6th (in green) and the subsequent Friday the 13th (in yellow) for 10 pairs (clusters) of dates. Note that, in every instance, the green bar is longer than its partner yellow bar. This indicates that the number of vehicles on the motorway decreased on Friday the 13th when compared with the previous Friday in every instance.
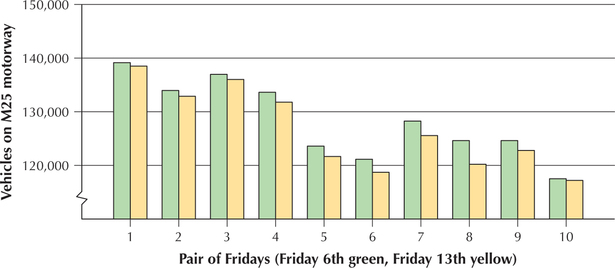 FIGURE 4 Clustered bar graph of motorway traffic.Page 7
 - Phase 3 Data presentation. The presentation of the results is important, and the researchers found a highly respectable journal, the British Medical Journal, in which to publish their findings. Other avenues for presentation are delivering a talk at a conference, writing up a report for one's supervisor, or presenting a class project.
- Phase 4 Data interpretation. Finally, the last facet in our definition of statistics is interpretation. It is crucial for those who are performing a statistical study to make their results understandable to the general public. It is not sufficient for the statistician alone to understand the results. Instead, the statistician must communicate the results clearly, whether in writing or orally. In this case, the researchers chose the decrease in number of vehicles as the criterion on which to base support for their hypothesis that people changed their behavior on Friday the 13th. Their finding of an observable decrease in traffic on Friday the 13th is consistent with their hypothesis.
2 Elements, Variables, and Observations
Every data set holds within it a story waiting to be told, as we saw in Section 1.1, Data Stories. To provide us with the tools to uncover these stories we need to learn some simple concepts, the building blocks of data analysis.
Descriptive statistics refers to methods for summarizing and organizing the information in a data set.
In descriptive statistics we use numbers (such as counts and percents), graphs, and tables to describe the data set, as a first step in data analysis. In Chapters 2 to 4, we will examine descriptive methods much more closely. But first we need to introduce a few terms. Suppose a data analyst for a health maintenance organization (HMO) is collecting data about the patients in a particular hospital, including the diagnosis, length of stay, gender, and total cost. The sources of the information (the patients) are called the elements. The patients' characteristics (for example, diagnosis, length of stay) are called the variables. Finally, the complete set of characteristics for a particular patient is called an observation.
Elements, Variables, and Observations
An element is a specific entity about which information is collected.
A variable is a characteristic of an element, which can assume different values for different elements.
An observation is the set of values of the variables for a given element.
When data are presented in tables and spreadsheets, it is typical practice to have the columns indicate the variables, and the rows to indicate the observations. So, for the hospital patients, the observation (specific values for the set of all the variables) for each element (patient) would appear as a row in the table.
EXAMPLE 5 Elements, variables, and observations
 Video Game Sales
Table 3 contains the top 30 best-selling video games in the United States for the week of May 17, 2014, along with the game platform, publishing studio, type of game, sales that week, total sales, and how many weeks the game has been on the list. Use Table 3 to answer the following questions.
- What are the variables?
- State the first five elements.
- List all the values that the variable platform takes.
- Provide the observation for Titanfall for Xbox One.
| Game | Platform | Studio | Type | Sales for week |
Sales total | Weeks on list |
|---|---|---|---|---|---|---|
| Minecraft for PS3 | PS3 | Sony | Adventure | 36,732 | 36,732 | 1 |
| Minecraft for Xbox 360 | Xbox 360 | MS | Adventure | 33,887 | 2,517,732 | 50 |
| Kirby: Triple Deluxe for 3DS | 3DS | Nintendo | Platform | 28,184 | 116,658 | 3 |
| MLB 14 The Show for PS4 | PS4 | Sony | Sports | 27,088 | 161,770 | 2 |
| Titanfall for Xbox One | Xbox One | Electronic Arts | Shooter | 23,244 | 1,150,856 | 10 |
| Call of Duty: Ghosts for Xbox 360 | Xbox 360 | Activision | Shooter | 15,781 | 5,243,214 | 28 |
| Bound by Flame for PS4 | PS4 | Focus | Action | 15,346 | 15,346 | 2 |
| Pokemon X/Y for 3DS | 3DS | Nintendo | Role-Playing | 14,543 | 3,442,714 | 32 |
| Titanfall for Xbox 360 | Xbox 360 | Electronic Arts | Shooter | 13,692 | 460,934 | 6 |
| Grand Theft Auto V for Xbox 360 | Xbox 360 | Take-Two | Action | 11,652 | 7,417,036 | 35 |
| Grand Theft Auto V for PS3 | PS3 | Take-Two | Action | 9,861 | 5,424,163 | 35 |
| Call of Duty: Ghosts for PS4 | PS4 | Activision | Shooter | 8,917 | 1,100,682 | 27 |
| Super Luigi U for Wii U | Wii U | Nintendo | Platform | 8,599 | 840,698 | 38 |
| Super Mario Bros. U for Wii U | Wii U | Nintendo | Action | 8,476 | 1,690,689 | 78 |
| Call of Duty: Ghosts for PS3 | PS3 | Activision | Shooter | 8,323 | 3,046,580 | 28 |
| Borderlands 2 for PSV | PSV | Take-Two | Shooter | 8,189 | 50,568 | 2 |
| Battlefield 4 for Xbox 360 | Xbox 360 | Electronic Arts | Shooter | 8,188 | 1,707,310 | 29 |
| Forza Motorsport 5 for Xbox One | Xbox One | MS | Racing | 7,910 | 736,743 | 26 |
| Call of Duty: Ghosts for Xbox One | Xbox One | Activision | Shooter | 7,777 | 1,139,310 | 26 |
| inFamous: Second Son for PS4 | PS4 | Sony | Action | 7,150 | 634,733 | 9 |
| Battlefield 4 for PS3 | PS3 | Electronic Arts | Shooter | 6,774 | 911,687 | 29 |
| NBA 2K14 for Xbox 360 | Xbox 360 | Take-Two | Sports | 6,593 | 1,597,734 | 33 |
| Spiderman 2 for PS4 | PS4 | Activision | Action | 6,510 | 49,292 | 3 |
| Super Mario 3D World for Wii U | Wii U | Nintendo | Platform | 6,064 | 835,941 | 26 |
| Yoshi's New Island for 3DS | 3DS | Nintendo | Action | 6,006 | 172,680 | 10 |
| Battlefield 4 for PS4 | PS4 | Electronic Arts | Shooter | 5,875 | 786,607 | 27 |
| Mario Golf for 3DS | 3DS | Nintendo | Action | 5,633 | 42,199 | 3 |
| Nintendo Land for Wii U | Wii U | Nintendo | Action | 5,428 | 1,550,278 | 78 |
| Mario Kart 7 for 3DS | 3DS | Nintendo | Racing | 5,353 | 3,394,162 | 128 |
| NBA 2K14 for PS4 | PS4 | Take-Two | Sports | 5,290 | 608,899 | 27 |
videogamesales
Solution
- The variables are the game platform, publishing studio, type of game, sales that week, total sales, and how many weeks the game has been on the list.
- The first five elements are Minecraft for PS3, Minecraft for Xbox 360, Kirby: Triple Deluxe for 3DS, MLB 14 The Show for PS4, and Titanfall for Xbox One.
- The variable platform takes the following values: PS3, Xbox 360, 3DS, PS4, Xbox One, Wii U, and PSV.
- The observation for Titanfall for Xbox One is as follows:
NOW YOU CAN DO
Exercises 11–13, 17–19, and 23–25
| Game | Platform | Studio | Type | Sales for week |
Sales total | Weeks on list |
|---|---|---|---|---|---|---|
| Titanfall for Xbox One | Xbox One | Electronic Arts | Shooter | 23,244 | 1,150,856 | 10 |
YOUR TURN#1
- List the values that the variable type takes.
- Provide the observation for Spiderman 2 for PS4.
(The solutions are shown in Appendix A.)
3 Qualitative and Quantitative variables; Discrete and continuous variables
Notice that we have variables that can take on various types of values, some of which are numbers and some of which are categories. For example, Titanfall for Xbox One had sales for the week of 23,244, and has been on the Top 30 list for 10 weeks. Each of these variables is numeric. On the other hand, the studio for Titanfall for Xbox One is Electronic Arts and the game type is shooter, which are characteristics that do not have numeric values but instead are categories. This leads us to define two types of variables: qualitative and quantitative.
 Not all numerical variables are quantitative. For example, a zip code such as 90210 is numerical. But we would not perform arithmetic on zip codes, such as adding two zip codes together. Therefore, zip codes are numerical but not quantitative.
A qualitative variable is a variable that may be classified into categories. A quantitative variable is a variable that takes numeric values and upon which arithmetical operations, such as addition or subtraction, may be meaningfully performed.
Qualitative variables are also called categorical variables, because they can be grouped into categories. For Titanfall for Xbox One, the qualitative variables are plat-form, studio, and type. The quantitative variables are sales for the week, sales total, and weeks on list.
EXAMPLE 6 Qualitative or quantitative?
Some of the most widespread applications of statistical analysis occur in the business world. Managers examine patterns and trends in data, thereby hoping to increase profitability. Table 4 shows the five most active stocks on the New York Stock Exchange (NYSE) and NASDAQ (National Association of Securities Dealers Automated Quotations), as reported by USA Today for June 3, 2014. (a) What are the elements and the variables of this data set? (b) Which variables are qualitative? Which are quantitative? (c) Provide the observation for Bank of America.

| Stock | Exchange | Last | Volume | Change |
|---|---|---|---|---|
| Quiksilver | NYSE | $3.41 | 59,328,858 | −$2.38 |
| Sirius XM | NASDAQ | $3.30 | 54,392,299 | +$0.02 |
| Bank of America | NYSE | $15.21 | 48,690,356 | −$0.05 |
| Newlead Holdings | NASDAQ | $0.76 | 46,703,983 | −$0.19 |
| Applied Materials | NASDAQ | $21.42 | 33,295,094 | +$4.39 |
Solution
- The elements are the five most active stocks traded on the NYSE and NASDAQ on this day in 2014. The variables are as follows:
- Exchange: the exchange where the stock was traded.
- Last: the most recent trading price for the stock.
- Volume: how many shares of the stock were traded that day.
- Change: the change in share price (in dollars) between the opening price and the closing price that day.
- The exchange, because it can be categorized as either NYSE or NASDAQ, is qualitative. The other variables are quantitative.
- The observation for Bank of America includes the exchange and the set of the day's stock data for that company. Bank of America is traded on the NYSE. Its last share price was $15.21 per share, 48,690,356 shares of its stock were traded, and the price decreased by $0.05 per share.
| Stock | Exchange | Last | Volume | Change |
|---|---|---|---|---|
| Bank of America | NYSE | $15.21 | 48,690,356 | −$0.05 |
NOW YOU CAN DO
Exercises 14, 20, and 26.
YOUR TURN#2
- Is Sirius XM an element or a variable?
- What is another term for the variable Exchange?
(The solutions are shown in Appendix A.)
Hint: A quantitative variable that must be counted (not measured) is probably a discrete variable, whereas a quantitative variable that must be measured (not counted) is probably a continuous variable.
Quantitative variables can be classified as either discrete or continuous.
A discrete variable can take either a finite or a countable number of values. Each value can be graphed as a separate point on a number line, with space between each point. A continuous variable can take infinitely many values, forming an interval on the number line with no space between the points.
EXAMPLE 7 Discrete or continuous?
Suppose we collect data on a statistics student in your class, including (a) number of math courses taken, and (b) grade point average (GPA). Determine whether these variables are discrete or continuous.
Solution
- Because the number of math courses is finite, the variable number of math courses taken is discrete.
- Because GPA can take an infinite number of possible values (for example, in the interval 0.0 to 4.0), the variable GPA is continuous.
NOW YOU CAN DO
Exercises 15, 21, and 27.
YOUR TURN#3
Consider a data set containing the competitors in the 100-meter dash in the Summer Olympics, where we keep track of the number of medals each competitor has won, along with their time in the 100-meter dash. State whether the following variables are discrete or continuous.
- Number of medals won.
- Racing time in the 100-meter dash.
(The solutions are shown in Appendix A.)
4 Levels of Measurement
Data may be classified according to the following four levels of measurement.
- Nominal data consist of names, labels, or categories. No natural or obvious ordering of nominal data (such as high to low) occurs. Arithmetic cannot be performed on nominal data.
- Ordinal data can be arranged in a particular order. However, no arithmetic can be performed on ordinal data.
- Interval data are similar to ordinal data, with the extra property that subtraction may be performed on interval data. No natural zero occurs for interval data.
- Ratio data are similar to interval data, with the extra property that division may be performed on ratio data. A natural zero does exist for ratio data.
EXAMPLE 8 Levels of measurement
Identify which level of measurement is represented by the following data.
- Years covered in European History 101: 1066–1492
- Annual income of students in Statistics 101 class: $0–$15,000
- Course grades in English 101: A, B, C, D, F
- Student gender: male, female
Solution
- The years 1066 to 1492 represent interval data. No natural zero occurs (no “year zero”; the calendar goes from 1 b.c. to a.d. 1). Also, division (1492/1066) does not make sense in terms of years, so that the data are not ratio data. However, subtraction does make sense, in that the course covers 1492−1066=426years.
- Student income represents ratio data. Here, division does make sense. That is, someone who made $4000 last year made twice as much as someone who made $2000 last year. Also, some students probably had no income last year, so that $0, the natural zero, also makes sense.
- Course grades represent ordinal data, because (a) they may be arranged in a particular order, and (b) arithmetic cannot be performed on them. The quantity A 2 B makes no sense.
- Student gender represents nominal data, because the data cannot be ordered in a natural or obvious way. Also, no arithmetic can be performed on student gender.
NOW YOU CAN DO
Exercises 16, 22, and 28.
YOUR TURN#4
Using Table 4, identify which level of measurement is represented by the following variables.
- Exchange
- Last price
(The solutions are shown in Appendix A.)
5 Statistical Inference
Descriptive methods of data analysis are widespread and quite informative. However, the modern field of statistics involves much more than simply summarizing a data set. For example, suppose a medical researcher is investigating caffeine consumption among 19- to 22-year-old Americans, and claims that more than 75% of Americans who are 19 to 22 years old consume caffeine. How should the medical researcher go about collecting evidence to support her claim? One method would be to ask each and every person in the population of 19- to 22-year-old Americans whether he or she consumes caffeine. In general, a population is the collection of all elements (persons, items, or data) of interest in a particular study.

This proportion of caffeine consumers is one characteristic of the population of American 19- to 22-year-olds. A characteristic of a population is called a parameter. However, to ask every 19- to 22-year-old in America about his or her caffeine consumption would be a daunting task that is expensive, time-consuming, and, in the end, simply impossible. So, unfortunately, the population proportion of 19- to 22-year-olds who consume caffeine remains unknown. The actual value of a population parameter is often unknown.
A sample is a subset of the population from which information is collected. For example, from a sample of one hundred 19- to 22-year-olds, suppose that 76 of them consume caffeine. That is, the sample proportion of students who consume caffeine is 76/100=76%. This proportion is a characteristic of the sample and is called a statistic. The advantage here is that, because the sample is relatively small, the characteristics of the sample can be determined. On the other hand, if we take a different sample, we are likely to get a different value for the sample proportion.
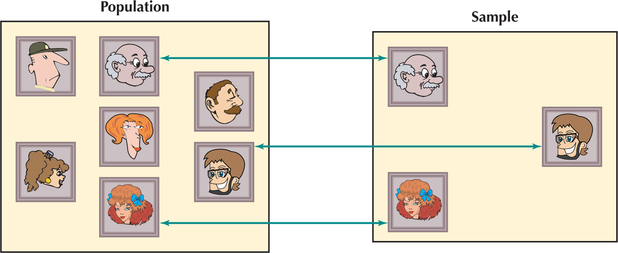
Populations, Parameters, Samples, and Statistics
A population is the collection of all elements (persons, items, or data) of interest in a particular study. A parameter is a characteristic of a population.
A sample is a subset of the population from which information is collected. A statistic is a characteristic of a sample.
EXAMPLE 9 Populations and samples
For the following scenarios, state whether the data represent a population or a sample.
- The seven continents: Asia, Africa, North America, South America, Europe, Antarctica, Australia
- Europe and North America
- All of Ludwig van Beethoven's nine symphonies
- Beethoven's 5th, 6th, and 9th symphonies
Solution
- Because all of the continents are listed, this group represents a population.
- Europe and North America represent a subset of the population of all continents and, therefore, represent a sample.
- Because all of Beethoven's symphonies are included, this represents a population.
- Because the 5th, 6th, and 9th symphonies represent a subset of all of Beethoven's symphonies, this is a sample.
NOW YOU CAN DO
Exercises 43–45 and 52–57.
YOUR TURN#5
For the following scenarios, state whether the data represent a population or a sample.
- The three largest counties in Florida.
- All of the counties in Florida.
(The solutions are shown in Appendix A.)
EXAMPLE 10 Parameters and statistics
For the following scenarios, state whether the indicated measure is a statistic or a parameter.
- The average income of the countries in all seven continents
- The average income of the countries in Europe and North America
- The shortest (in time) of all of Beethoven's nine symphonies
- The shortest (in time) of Beethoven's 5th, 6th, and 9th symphonies
Solution
- Because all seven continents represent a population, the average income is a parameter.
- Only two of the seven continents are represented, so the average income of this sample is a statistic.
- Since all of Beethoven's nine symphonies represent a population, the shortest time is a parameter.
- Only three of the nine symphonies are represented, so the shortest time of this sample is a statistic.
NOW YOU CAN DO
Exercises 46–48.
YOUR TURN#6
For the following scenarios, state whether the indicated measure is a statistic or a parameter.
- The most expensive hotel in the three largest counties in Florida
- The most expensive hotel in all of Florida (that is, all of the counties in Florida)
(The solutions are shown in Appendix A.)
The U.S. Constitution requires that a census be conducted every 10 years. A census is the collection of data from every element in the population. As you can imagine, such a task is very difficult and very expensive. In fact, the Census Bureau estimates that the 2000 U.S. census “undercounted the actual U.S. population by over three million individuals.”2
It is often best to gather data from a sample, a subset of that population, for the following reasons.
- The population you are interested in studying may be too large to allow you to elicit information from every element.
- Time and money often constrain the researcher to choosing a sample instead of studying the entire population.
- In some experiments, the resource is exhausted when testing is done (for example, in estimating the mean lifetime of light bulbs).
- Finally, it may be simply impossible to gather information from the entire population, such as when studying the quality of water in Lake Erie.
For instance, it would be impractical to contact every 19- to 22-year-old in the country for a survey about caffeine consumption. Instead, to estimate the proportion of all American 19- to 22-year-olds who consume caffeine, we can use statistical inference. Statistical inference refers to learning about the characteristics of a population by studying those characteristics in a subset of the population (that is, in a sample).
The journal Pediatrics reported3 that a survey of 2600 Americans ages 19 to 22 found that 77% of them were consumers of caffeine. These 2600 teenagers and young adults represent a sample, and their characteristics can be known. Thus, at this point, the medical researcher can make the inference that the proportion of all American 19- to 22-year-olds who consume caffeine is 77%, because this is the proportion in the sample. In doing this, the medical researcher is performing statistical inference.
Statistical inference consists of methods for estimating and drawing conclusions about population characteristics based on the information contained in a subset (sample) of that population.
“Now wait just a minute,” you might object. “How can you say that the proportion of all 19- to 22-year-old Americans who consume caffeine is 77% just because your sample proportion is 77%?” Actually, you have a point. We are generalizing. We are taking what we know about a portion of the whole (a sample) and using it to draw a conclusion about the whole (the population). However, although the true proportion of 19- to 22-year-old Americans who consume caffeine is probably not exactly 77%, it is most likely not very far from 77%. The 77% is an estimate, an approximation based on sample data. In Chapter 8, we will learn how we can get the estimate as close as we wish to the actual value just by taking a large enough sample.
Finally, we need to point out one further attribute of parameters and statistics. The value of a parameter, although it is unknown, is a fixed constant. For example, the average age of all persons in your home state (population) at noon today is unknown, but it still exists, and it is a specific number. On the other hand, the value of a statistic depends on the sample. For example, a sample of 100 people in your hometown may produce an average age of 31. The average age of a sample of 100 people in a neighboring town may be 32. Later, we will learn that this is because a statistic is a random variable.
Of course, to deliver a valid estimate, the sample needs to be representative of the population. The sample should not differ systematically in any major characteristic from the population. We will learn more about this in Section 1.3, when we study sampling methods. Table 5 summarizes the attributes of a population and a sample.
| Population | Sample | |
|---|---|---|
| Thumbnail definition | All elements | Subset of population |
| Characteristic | Parameter | Statistic |
| Value | Usually unknown | Usually known |
| Status | Constant | Depends on sample |
Parameters are measures from a population, whereas statistics are measures from a sample. The characteristic associated with the population starts with the same letter, and the same is true for sample.
EXAMPLE 11 Descriptive statistics or statistical inference?
State whether the following situations illustrate the use of descriptive statistics or statistical inference.
- In Baltimore County, Maryland, the average amount spent per week on gasoline consumption in a sample of 500 commuters was $75. The county government infers that the average amount spent weekly by all Baltimore County commuters is $75.
- A sample of 100 residents of Broward County, Florida, yielded 27 residents who work for the government at the local, state, or federal level. Thus, 27% of these 100 residents work for the government.
- The average age of a sample of 200 residents of Garden City, New York, was 34 years old.
- In a survey of 1000 citizens in the Seattle, Washington, metropolitan area, 570 said they would pay higher prices in order to reduce greenhouse emissions. City planners conclude that 57% of all Seattle citizens would do so.
Solution
- Statistical inference. A sample was taken, and a sample statistic ($75 per week) was calculated. Then the county government used this statistic to make the statistical inference that this was the average amount spent by all Baltimore County commuters.
- Descriptive statistics. Though a sample was taken, there was no attempt to make an inference from this sample of 100 workers to the entire population of Broward County, Florida. So, no statistical inference is being made here.
- Descriptive statistics. The average age of 34 years old is a descriptive statistic, because it describes the sample. However, no inference is made regarding a larger population.
- Statistical inference. The survey found that 57% of the sample of 1000 citizens would pay higher prices in order to reduce greenhouse emissions. This 57% is a statistic. Then the city planners used this statistic in order to perform statistical inference about the population of all Seattle citizens.
NOW YOU CAN DO
Exercises 49–51 and 58–64.
YOUR TURN#7
State whether the following situations illustrate the use of descriptive statistics or statistical inference.
- Your instructor states that the average grade on the first quiz for your class is 85.
- In 10 games of ping pong, Jessica has lost to her friend Lu Li 8 times. Jessica sadly concludes that, going forward, she has only a 20% chance of winning a game of ping pong against her friend Lu Li.
(The solutions are shown in Appendix A.)
A Statistical Literacy Quiz
Regardless of major, every student in America (indeed, every citizen) needs to become statistically literate in order to survive in today's wired society. Why not take this quiz to find out if you are statistically literate? Answer each question true or false.
- A fair coin is tossed five times and comes up heads each time. That means that tails is “due” and the chances of tails on the next toss is increased.
- One politician says that the mean income is rising, whereas another politician says that the median income is falling. One of them has to be lying.
- Jim is tested for HIV and the test comes back positive. Thus, Jim is HIV-positive.
The correct answer to each question is false. Question 1 deals with something called “the Gambler's Fallacy,” and we will cover this, along with the explanation for Question 3, in Chapter 5, “Probability.” We will deal with Question 2, the quirks of means and medians, in Chapter 3, “Describing Data Numerically.”