Section 5.1 Exercises
CLARIFYING THE CONCEPTS
Question 5.1
1. Describe in your own words how chance and uncertainty affect you in your life. List some synonyms that we use in everyday life for the word probability. (p. 240)
5.1.1
Answers will vary; chance, likelihood.
Question 5.2
2. Why do you think we use numerical values for probability instead of only qualitative terms such as “likely” or “impossible”? (p. 242)
Question 5.3
3. Give three examples from your own life of experiments, as the term is used in this chapter. (p. 241)
- For each experiment, what are some of the outcomes?
- Write out the sample space of one of these experiments.
- Describe how the Law of Total Probability applies to the sample.
5.1.3
Answers will vary.
Question 5.4
4. List the three methods for assigning probabilities. (pp. 243, 248, 251)
Question 5.5
5. What assumption do we need to make to use the classical method? (p. 244)
5.1.5
The experiment has equally likely outcomes.
Question 5.6
6. When can we use the relative frequency method? (p. 249)
Question 5.7
7. If we can’t use either the classical method or the relative frequency method, explain how we go about using the subjective method. (p. 252)
5.1.7
We consider all available information, tempered by our experience and intuition, and then assign a probability value that expresses our estimate of the likelihood that the outcome will occur.
Question 5.8
8. The experiment is to toss 10 fair coins 25 times each. Which methods can we use to assign probabilities? (pp. 243, 248)
Question 5.9
9. How would you find the probability that a randomly chosen student at your college likes hip-hop music? What method would you use? (p. 248)
5.1.9
First find out how many students are at your college and then find out how many of them like hip-hop music. Then calculate the relative frequency of students who like hip-hop music. Use the relative frequency method.
PRACTICING THE TECHNIQUES
 CHECK IT OUT!
| To do | Check out | Topic |
|---|---|---|
| Exercises 11–16 | Example 1 | Probability models |
| Exercises 17–20 | Example 2 | Determining unusual or likely outcomes |
| Exercises 21–24 | Example 3 | Single draw from deck of cards |
| Exercises 25–30 | Example 4 | Single fair die |
| Exercises 31–38 | Example 5 | Tree diagrams and sample space |
| Exercises 39–42 | Example 6 | Tossing a fair coin twice |
| Exercises 43–50 | Example 7 | Tossing two fair dice |
| Exercises 51–60 | Example 10 | Relative frequency method. |
| Exercises 61–62 | Example 11 | Probability models based on frequency tables |
Determine whether each table in Exercises 11–16 is a probability model. If not, clearly explain why it is not a probability model.
Question 5.11
11. Customers at a clothing store at the mall
| Gender | Probability |
|---|---|
| Females | 1.1 |
| Males | –0.2 |
5.1.11
Not a probability model. The probability for males is negative and the probabilities don't add up to 1.
Question 5.12
12. Singers in the church choir
| Voice | Probability |
|---|---|
| Soprano | 0.50 |
| Alto | 0.25 |
| Tenor | –0.25 |
| Bass | 0.25 |
Question 5.13
13. Voters at a town meeting
| Party | Probability |
|---|---|
| Democrat | 0.25 |
| Republican | 0.25 |
| Independent | 0.3 |
| Green | 0.1 |
| Libertarian | 0.1 |
| Other | 0.1 |
5.1.13
Not a probability model. The probabilities don't add up to 1.
Question 5.14
14. Majors of students taking introductory statistics
| Major | Probability |
|---|---|
| Business | 0.50 |
| Nursing | 0.20 |
| Social sciences | 0.20 |
| Science | 0.20 |
| Math | −0.10 |
Question 5.15
15. Students taking undergraduate introductory statistics
| Class | Probability |
|---|---|
| Freshmen | 0.15 |
| Sophomores | 0.25 |
| Juniors | 0.40 |
| Seniors | 0.20 |
5.1.15
Probability model.
Question 5.16
16. Reasons why Hurricane Katrina survivors did not evacuate
| Reason | Probability |
|---|---|
| I did not have a car or a way to leave. | 0.36 |
| I thought the storm and its aftermath would not be as bad as they were. |
0.29 |
| I just didn't want to leave. | 0.10 |
| I had to care for someone who was physically unable to leave. |
0.07 |
| All other reasons | 0.18 |
For the probabilities in Exercises 17–20, determine the meaning of the indicated probability.
Question 5.17
17. The doctor said the chances of recovery from the surgery were near 100%.
5.1.17
“The chances of recovering from the surgery is near 100%” means that the probability of recovering from the surgery is near 1. Therefore it is almost certain that the person will recover from the surgery.
Question 5.18
18. The parent said that, if the student’s grades did not improve, there was no chance of getting the new video game system for a birthday present.
Question 5.19
19. The stockbroker said the chances were high that the blue chip stock would gain in value this year.
5.1.19
“The chances are high that the blue chip stock will gain in value this year” means that the probability that the blue chip stock will gain in value this year is near 1. Therefore it is almost certain that the blue chip stock will gain in value this year.
Question 5.20
20. The political analyst gloomily told the candidate that his chances of winning the election were about 2%.
For Exercises 21–24, the experiment is to draw a card at random from a shuffled deck of 52 cards. Find the following probabilities:
Question 5.21
21. Drawing a jack
5.1.21
113
Question 5.22
22. Drawing a club
Question 5.23
23. Drawing the jack of clubs
5.1.23
152
Question 5.24
24. Drawing a red card
For Exercises 25–30, the experiment is to roll a fair die once. Find the following probabilities:
Question 5.25
25. Observing a 2
5.1.25
16
Question 5.26
26. Observing an odd number
Question 5.27
27. Observing a number greater than 2
5.1.27
23
Question 5.28
28. Observing a number less than 2
Question 5.29
29. Observing a 2 or a 3
5.1.29
13
Question 5.30
30. Observing a 2 and a 3
For Exercises 31 and 32, consider the experiment of tossing a fair die two times, with the outcomes being the observation of either an even number or an odd number.
Question 5.31
31. Construct a tree diagram for the experiment.
5.1.31
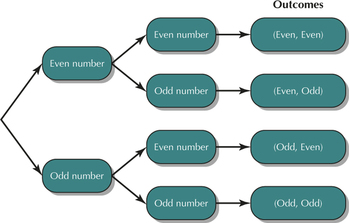
Question 5.32
32. Construct the sample space for the experiment.
For Exercises 33 and 34, let the experiment be tossing a fair die two times, with the outcomes being observing either a number less than 4 or a number greater than or equal to 4.
Question 5.33
33. Construct a tree diagram for the experiment.
5.1.33
Let L= tossing a number less than 4 and G= tossing a number greater than or equal to 4.
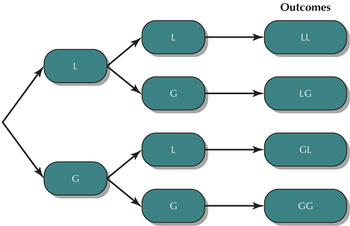
Question 5.34
34. Construct the sample space for the experiment.
For Exercises 35–38, consider the experiment of tossing a fair coin three times and observing either heads or tails.
Question 5.35
35. Construct a tree diagram for the experiment.
5.1.35
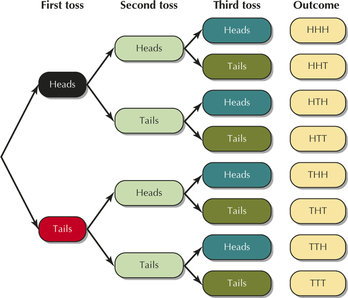
Question 5.36
36. Construct the sample space for the experiment.
Question 5.37
37. How does the tree diagram help to construct the sample space?
5.1.37
We can follow the branches to get all possible outcomes.
Question 5.38
38. How do we find each outcome using the tree diagram?
For Exercises 39–42, consider the experiment of tossing a fair coin twice.
Question 5.39
39. Find the probability of observing zero heads.
5.1.39
14
Question 5.40
40. Find the probability of observing exactly one head.
Question 5.41
41. Find the probability of observing two heads.
5.1.41
14
Question 5.42
42. Use your results from Exercises 39–41 to construct the probability model for the number of heads observed when tossing a fair coin twice.
For Exercises 43–50, consider the experiment of tossing two fair dice and observing the sum of the two dice. (Hint: Use the sample space in Figure 3 on page 247.)
Question 5.43
43. What is the probability that the sum of the dice equals 9?
5.1.43
19
Question 5.44
44. Find the probability that the dark green die equals 9.
Question 5.45
45. Calculate the probability that the sum of the dice equals 11.
5.1.45
118
Question 5.46
46. Find the probability that the light green die equals 5.
Question 5.47
47. What is the probability that the sum of the dice equals 1?
5.1.47
0
Question 5.48
48. Construct the probability model for the sum of the dice.
Question 5.49
49. Use the probability model to find which event has the greatest probability.
5.1.49
Sum of 7
Question 5.50
50. Which events have the lowest probability?
For Exercises 51–56, suppose that, in a sample of 100 students who drink hot caffeinated beverages, 35 preferred regular coffee, 20 preferred latte, 20 preferred cappuccino, and 25 preferred tea. Find the probability that a randomly selected student prefers the following:
Question 5.51
51. Regular coffee
5.1.51
720
Question 5.52
52. Latte
Question 5.53
53. Cappuccino
5.1.53
15
Question 5.54
54. Tea
Question 5.55
55. For Exercises 51–54, which method of assigning probability are you using?
5.1.55
Relative frequency method
Question 5.56
56. Construct the probability model for hot caffeinated beverages.
For Exercises 57–60, suppose that, in a sample of 200 college students, 80 live on campus, 80 live with family off campus, and 40 live in an apartment off campus. Find the probability that a randomly selected student lives in the following places:
Question 5.57
57. On campus
5.1.57
25
Question 5.58
58. With family off campus
Question 5.59
59. In an apartment off campus
5.1.59
15
Question 5.60
60. Construct the probability model for where these students live.
Question 5.61
61. Use the following frequency table to estimate the probabilities for each color and construct the probability model. A sample of 100 students was asked to name their favorite color.
| Favorite color | Frequency |
|---|---|
| Red | 25 |
| Blue | 25 |
| Green | 20 |
| Black | 10 |
| Violet | 10 |
| Yellow | 10 |
5.1.61
| Favorite color | Probability |
|---|---|
| Red | 14 |
| Blue | 14 |
| Green | 15 |
| Black | 110 |
| Violet | 110 |
| Yellow | 110 |
Question 5.62
62. Use the following frequency table to estimate the probabilities for each season and construct the probability model. A sample of 200 students was asked to name their favorite season.
| Favorite season | Frequency |
|---|---|
| Summer | 70 |
| Spring | 70 |
| Autumn | 50 |
| Winter | 10 |
APPLYING THE CONCEPTS
Question 5.63
63. Technology Adopters. The Gallup organization published a study4 in which they categorized American technology adopters as either Super Tech Adopters (31%), Smart Phone Reliants (19%), Mature Technophiles (22%), or Tech-Averse Olders (28%). Consider the experiment of two American technology adopters at random.
- Construct the tree diagram for the experiment.
- What is the sample space?
5.1.63
(a)
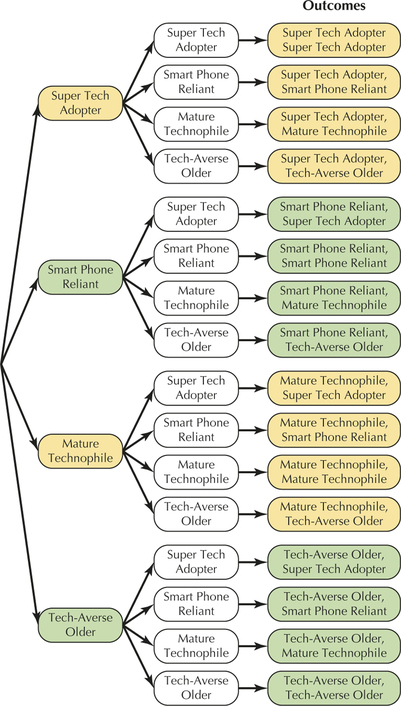
(b) {{Super Tech Adopter, Super Tech Adopter}, {Super Tech Adopter, Smart Phone Reliant}, {Super Tech Adopter, Mature Technophile}, {Super Tech Adopter, Tech-Averse Older}, {Smart Phone Reliant, Super Tech Reliant}, {Smart Phone Reliant, Smart Phone Reliant}, {Smart Phone Reliant, Mature Technophile}, {Smart Phone Reliant, Tech-Averse Older}, {Mature Technophile, Super Tech Adopter}, {Mature Technophile, Smart Phone Reliant}, {Mature Technophile, Mature Technophile}, {Mature Technophile, Tech-Averse Older}, {Tech-Averse Older, Super Tech Adopter}, {Tech-Averse Older, Smart Phone Reliant}, {Tech-Averse Older, Mature Technophile}. {Tech-Averse Older, Tech-Averse Older}
Question 5.64
64. Facebook Females and Males. The Facebook Social Ads Platform reported the following number of users in the United States in 2014, by gender: females: 96 million, males: 82 million, unknown: 2 million.
- Construct a relative frequency distribution.
- Use the relative frequency method to assign probabilities to each outcome.
- Consider the experiment of choosing three Facebook users at random. Construct the tree diagram for the experiment.
- What is the sample space for the experiment in (c)?
Question 5.65
65. Owning a Time Machine. The Pew Research Internet Project reported that 14 of the 144 people ages 18–29 that it surveyed would someday like to own a time machine.5
- What is the probability that a randomly chosen 18- to 29-year-old would someday like to own a time machine?
- What is the probability that a randomly chosen 18- to 29-year-old would not someday like to own a time machine?
- Which method of assigning probability did you use?
5.1.65
(a) 772 (b) 6572 (c) Relative frequency method
Question 5.66
66. Basketball. Your college's basketball team is playing a game next week.
- What is the probability that the team will win the game?
- Which method did you use?
Question 5.67
67. Brisbane Babies. The table shows the births of babies at a Brisbane, Australia, hospital on a particular day.6
| Girl | Girl | Boy | Boy | Boy | Girl | Girl | Boy | Boy |
| Boy | Boy | Boy | Girl | Girl | Boy | Girl | Girl | Boy |
| Boy | Boy | Boy | Girl | Girl | Girl | Girl | Boy | Boy |
| Boy | Girl | Boy | Girl | Boy | Boy | Boy | Boy | Boy |
| Girl | Boy | Boy | Boy | Boy | Girl | Girl | Girl |
- Construct a relative frequency distribution of the numbers of girls and boys born.
- Use the relative frequencies to construct a probability model.
- Confirm that your probability model follows the Rules of Probability.
5.1.67
(a)
| Frequency | Relative frequency | |
|---|---|---|
| Girls | 18 | 18/44=0.4091 |
| Boys | 26 | 26/44=0.5909 |
| Total | 44 | 44/44=1.0000 |
(b)
| Outcome | Probability |
|---|---|
| Girl | 18/44=0.4091 |
| Boy | 26/44=0.5909 |
Question 5.68
68. Draw an Ace. If you draw the ace of spades from a deck of cards, you win $200.
- What is the probability of winning this game?
- What would be a fair price for playing this game? (Hint: A fair price might be determined by balancing out the winnings and the price in the long run.)
Question 5.69
69. A Bazaar Game. Lenny has gone to the church bazaar with his family. In one of the games at the bazaar, if Lenny rolls two dice and gets a sum of at least 10, he wins $10; otherwise, he wins nothing.
- Find the probability of winning $10.
- Find the probability of winning nothing.
- What would you suggest would be a fair (break-even) price for playing this game?
5.1.69
(a) 16 (b) 56 (c) $1.67
Question 5.70
70. Sharing Social Media Profiles. The Pew Research Center reported that 98 of the 889 social media users in committed relationships that it surveyed shared a social media profile with their partners.7
- Explain whether or not you can use the classical method of assigning probability to find the probability of sharing a social media profile with a partner, and why.
- Find the probability that a social media user in a committed relationship shares a social media profile with his or her partner. Which method did you use?
For Exercises 71–75, consider the experiment of tossing a fair coin three times and observing either heads or tails.
Question 5.71
71. Find the probability of zero heads.
5.1.71
1/8=0.125
Question 5.72
72. What is the probability of exactly one head?
Question 5.73
73. Calculate the probability of exactly two heads.
5.1.73
3/8=0.375
Question 5.74
74. Find the probability of exactly three heads.
Question 5.75
75. Use your results from Exercises 71–74 to construct a probability model for the number of heads observed.
5.1.75
| Number of heads | Probability |
|---|---|
| 0 | 1/8=0.125 |
| 1 | 3/8=0.375 |
| 2 | 3/8=0.375 |
| 3 | 1/8=0.125 |
Question 5.76
76. For Exercises 71–74, which method of assigning probability are you using?
For Exercises 77–80, consider the experiment of tossing a fair coin three times. Find the indicated probabilities. (Hint: Use a tree diagram similar to the one on page 246, but add one more stage.)
Question 5.77
77. Observing 3 heads
5.1.77
18
Question 5.78
78. Not observing 3 heads
Question 5.79
79. Observing 2 tails
5.1.79
38
Question 5.80
80. Not observing 2 tails
Question 5.81
fairfaxincome
81. Fairfax County Income. The following table contains a probability model for the distribution of income in Fairfax County, Virginia.
- Use technology to draw random samples of sizes 10, 100, 1,000, and 10,000 from this probability model.
- What can you conclude about the relative frequencies as the sample size increases?
| Annual income | Probability |
|---|---|
| Under $25,000 | 0.083 |
| $25,000 to $49,999 | 0.166 |
| $50,000 to $74,999 | 0.169 |
| $75,000 to $99,999 | 0.160 |
| $100,000 to $149,999 | 0.200 |
| $150,000 or more | 0.222 |
5.1.81
(a) Answers will vary. (b) As the sample size increases, the relative frequencies approach the probabilities.
Teenagers' Music and Lifestyle. Every year, USA Weekend conducts a survey of the nation's teenagers, asking them various questions about lifestyle and music. Nearly 60,000 teenagers responded to the survey, conducted in part through a Web site. Use this information for Exercises 82 and 83.
Question 5.82
82. One USA Weekend survey question asked teenagers, “Do you listen to music while you are …?” and listed several options. The most common responses are shown in the table. Respondents could choose more than one response. Explain why you cannot construct a probability model with these percentages.
| Doing chores | 79% |
| On the computer | 73% |
| Doing homework | 72% |
| Eating meals at home | 33% |
| In the classroom | 18% |
Question 5.83
teenmusic
83. Another survey question asked by USA Weekend was “If you had to choose just one type of music to listen to exclusively, which would it be?” The results are shown in the table.
| Hip-hop/rap | 27% |
| Pop | 23% |
| Rock/punk | 17% |
| Alternative | 7% |
| Christian/gospel | 6% |
| R&B | 6% |
| Country | 5% |
| Techno/house | 4% |
| Jazz | 1% |
| Other | 4% |
- Construct a probability model.
- Is it unusual for a respondent to prefer jazz?
- Use technology to draw random samples of sizes 10, 100, 1,000, and 10,000 from your probability model.
- What can you conclude about the relative frequencies as the sample size increases?
5.1.83
(a)
| Type of music | Probability |
|---|---|
| Hip-hop/rap | 0.27 |
| Pop | 0.23 |
| Rock/Punk | 0.17 |
| Alternative | 0.07 |
| Christian/gospel | 0.06 |
| R&B | 0.06 |
| Country | 0.05 |
| Techno/house | 0.04 |
| Jazz | 0.01 |
| Other | 0.04 |
(b) Yes. (c) Answers will vary. (d) As the sample size increases, the relative frequencies approach the probabilities.
Question 5.84
84. Paul the Predicting Octopus. During the 2010 World Cup, Paul the Octopus picked the correct outcome of each soccer match in which Germany was involved, and then he continued his winning streak right to the end, picking champion Spain in the final match. Paul indicated his choice by swimming over and choosing one of two containers of mussels (his favorite food). Each container had the flag of a country in the day's match. Paul predicted the outcome correctly eight times in a row.
- Find the probability of Paul predicting all eight matches correctly, assuming a success probability of 50% for each match. Express this answer in the form (1/2)k, where k is the number of matches.
- Let's say that Paul had predicted nine matches in a row correctly. Find the probability of doing so, assuming 50% probability of success for each match. Express this answer in the form (1/2)k.
- What is the ratio of your results from (b) to your results from (a)?
- Use your results from (a)–(c) to form a general rule for the probability of correctly predicting k matches in a row when the probability of success for each match is 50%.
Question 5.85
 85. Refer to the previous exercise. What if the probability of Paul predicting correctly was larger than 50%? Would your answers to the following be greater or less than what you calculated in the previous exercise?
- The probability of Paul predicting all eight matches in a row correctly
- The probability of Paul predicting nine matches in a row correctly
5.1.85
(a) Greater (b) Greater
Use the following information for Exercises 86–91. Consider the experiment where a fair die is rolled twice. Define the following events for each roll: low={1,2},medium={3,4},high={5,6},odd={1,3,5},even={2,4,6}.
Question 5.86
86. Construct a tree diagram for this experiment. Make sure you use the outcomes and not the events.
Question 5.87
87. Use the tree diagram to construct the sample space. To which sample space discussed in Section 5.1 is the sample space for this experiment similar? Explain why this is so.
5.1.87
{(1,1),(1,2),(1,3),(1,4),(1,5),(1,6),(2,1),(2,2),(2,3),(2,4),(2,5),(2,6),(3,1),(3,2),(3,3),(3,4),(3,5),(3,6),(4,1),(4,2),(4,3),(4,4),(4,5),(4,6),(5,1),(5,2),(5,3),(5,4),(5,5),(5,6),(6,1),(6,2),(6,3),(6,4),(6,5),(6,6),}
Example 5.5, Experiment is tossing 2 fair dice.
Question 5.88
88. The sample space is the collection of all possible outcomes of an experiment. Explain why the sample space is not defined as the collection of all possible events.
Question 5.89
89. Find the probability of observing a 1, followed by another 1. What method of assigning probability are you using? Why?
5.1.89
1/36. Classical probability method; have the sample space but no actual data and can assume outcomes are equally likely
Question 5.90
90. Find the probability of observing two high die rolls. What method of assigning probability are you using? Why?
Question 5.91
91. Find the following probabilities:
- Two high die results
- Exactly one medium die result
- No low die results
- At least one high die result
- At most one medium die result
5.1.91
(a)1/9 (b) 4/9 (c) 4/9 (d) 5/9 (e) 8/9
BRINGING IT ALL TOGETHER
Best-Selling Video Games. Table 5 contains the top 20 best-selling video games in the United States for the week of May 17, 2014, along with the game platform, publishing studio, and the type of game. Use this information for Exercises 92–98.
| Game/Platform | Studio | Type |
|---|---|---|
| Minecraft for PS3 | Sony | Adventure |
| Minecraft for Xbox 360 | MS | Adventure |
| Kirby: Triple Deluxe for 3DS | Nintendo | Platform |
| MLB 14 The Show for PS4 | Sony | Sports |
| Titanfall for Xbox One | Electronic Arts |
Shooter |
| Call of Duty: Ghosts for Xbox 360 |
Activision | Shooter |
| Bound by Flame for PS4 | Focus | Action |
| Pokemon X/Y for 3DS | Nintendo | Roleplaying |
| Titanfall for Xbox 360 | Electronic Arts |
Shooter |
| Grand Theft Auto V for Xbox 360 |
Take-Two | Action |
| Grand Theft Auto V for PS3 | Take-Two | Action |
| Call of Duty: Ghosts for PS4 | Activision | Shooter |
| Super Luigi U for WiiU | Nintendo | Platform |
| Super Mario Brothers U for WiiU |
Nintendo | Action |
| Call of Duty: Ghosts for PS3 | Activision | Shooter |
| Borderlands 2 for PSV | Take-Two | Shooter |
| Battlefield 4 for Xbox 360 | Electronic Arts |
Shooter |
| Forza Motorsport 5 for Xbox One |
MS | Racing |
| Call of Duty: Ghosts for Xbox One |
Activision | Shooter |
| inFamous: Second Son for PS4 | Sony | Action |
Question 5.92
92. Suppose our experiment is to select one video game at random from Table 5 and observe its studio. What are the possible outcomes of this experiment?
Question 5.93
93. Find the probability that the video game studio is Sony.
5.1.93
320
Question 5.94
94. Continue to find the probability of each outcome in Exercise 93. Combine these to construct the probability model for this experiment. Which method of assigning probability did you use?
Question 5.95
95. Verify that your probability model in Exercise 94 meets the Rules of Probability.
5.1.95
All probabilities are between 0 and 1 and the sum of the probabilities is 1.
Question 5.96
96. Next, suppose our experiment is to select, at random, two video games in succession and to observe the type of game.
- Construct a tree diagram for this experiment.
- Use the tree diagram to generate the sample space.
Question 5.97
97. Construct a relative frequency distribution of the type of game.
5.1.97
| Type | Relative frequency |
|---|---|
| Adventure | 110 |
| Platform | 110 |
| Sports | 120 |
| Shooter | 25 |
| Action | 14 |
| Role-playing | 120 |
| Racer | 120 |
Question 5.98
98. Use your relative frequency distribution from Exercise 97 to construct a probability model of type. Verify that your probability model meets the Rules of Probability.
![]() Use the Law of Large Numbers for Proportions applet for Exercises 99 and 100.
Use the Law of Large Numbers for Proportions applet for Exercises 99 and 100.
Question 5.99
99. Set the probability of heads to 0.5 and the number of tosses to 40. Click Toss.
- Record the proportion of heads observed.
- Without pressing Reset, continue to click Toss until the total number of tosses is 120. Again, record the proportion of heads.
- Without pressing Reset, continue to click Toss until the total number of tosses is 240. Again, record the proportion of heads.
- Without pressing Reset, continue to click Toss until the total number of tosses is 480. Again, record the proportion of heads.
5.1.99
(a)–(d) Answers will vary.
Question 5.100
100. The proportions you recorded in Exercise 99 are relative frequencies of heads. What can you conclude about the relative frequencies as the sample size increases?
WORKING WITH LARGE DATA SETS
 Chapter 5 Case study: the Gardasil Vaccine.
Open the data set Gardasil. We shall explore some probabilities about clinic location and patient insurance type, using the tools and techniques we have learned in this section. Use technology to do Exercises 101–106.
Question 5.101
gardasil
101. Construct a frequency distribution of the variable Clinic Location.
5.1.101
| Clinic location | Frequency |
|---|---|
| Suburban | 963 |
| Urban | 450 |
| Total | 1413 |
Question 5.102
gardasil
102. Use the frequency distribution from Exercise 101 to construct a probability model for the location of the clinic.
Question 5.103
gardasil
103. What is the probability that a randomly chosen clinic will be urban? What method are you using to assign this probability?
5.1.103
0.3185; Relative frequency method
Question 5.104
gardasil
104. Construct a frequency distribution of the variable Insurance Type.
Question 5.105
gardasil
105. Use the frequency distribution from Exercise 104 to construct a probability model for type of insurance.
5.1.105
| Insurance Type | Relative frequency ≈ Probability |
|---|---|
| Hospital-based | 0.0594 |
| Med assistance | 0.1946 |
| Military | 0.2343 |
| Private payer | 0.5117 |
Question 5.106
gardasil
106. What is the probability that a randomly chosen patient will have a private payer insurance type? What method are you using to assign this probability?