6.3Poisson Probability Distribution
OBJECTIVES By the end of this section, I will be able to …
- Explain the requirements for the Poisson probability distribution.
- Compute probabilities for a Poisson random variable.
- Calculate the mean, variance, and standard deviation of a Poisson random variable.
- Use the Poisson distribution to approximate the binomial distribution.
1 Requirements for the poisson Distribution
The Poisson distribution was developed in 1838 by Siméon Denis Poisson (1781–1840), a French mathematician and physicist, who published more than 300 works in mathematical physics.
The Poisson distribution, like the binomial distribution, is a discrete probability distribution. The Poisson probability distribution is used when we wish to find the probability of observing a certain number of occurrences (X) of a particular event within a fixed interval of space or time. For example, the number of calls X per hour to a 911 emergency center follows a Poisson distribution, as does the number of typographical errors X per chapter in a book.
Poisson Probability Distribution
The Poisson probability distribution is a discrete probability distribution that is used when observing the number of occurrences of an event within a fixed interval of space or time. The random variable X represents the number of occurrences of the event in the interval.
Requirements for the Poisson Probability Distribution
- The occurrences must be random.
- Each occurrence must be independent.
- The occurrences must be uniformly distributed over the given interval.
For a binomial random variable, the maximum number of successes X is the number of trials n. But for the Poisson random variable, there is no upper limit to the number of occurrences X. For example, there is no upper limit to the number of calls X per hour to a 911 emergency center.
EXAMPLE 21Recognizing when to use the Poisson distribution
For each of the following situations, state whether or not the random variable X follows a Poisson probability distribution. If not, state why not.
- X is the number of telephone poles along a particular one-mile stretch of highway.
- X is the number of rabbits living in a particular five-acre plot of land scheduled for development.
- X is the number of calls to a radio station phone line in the hour following the announcement of a two-free-ticket giveaway to a sold-out concert.
- X is the number of customers who purchase gasoline at a particular filling station from 2 P.M. to 2:15 P.M.
Solution
- X does not follow a Poisson distribution. Telephone poles are spaced equidistantly from each other. Knowing the distance between the first two poles gives us the distance to each of the succeeding poles. This violates the requirement that the occurrences be random.
- X does not follow a Poisson distribution. Related rabbits live together in warrens or dens. Thus, if there is one rabbit living within the specified area, there is probably more than one. This violates the independence requirement.
- X does not follow a Poisson distribution. Presumably, the radio station would be inundated with calls within the first few minutes of the announcement. Later, there would be fewer calls to the station. This violates the requirement that the occurrences be uniformly distributed throughout the interval.
- X does follow a Poisson distribution. The customers are random, independent, and occur uniformly over the 15-minute period.
NOW YOU CAN DO
Exercises 5–8.
2Computing Probabilities for a Poisson Random Variable
In Section 6.2, we used the binomial probability distribution formula to compute binomial probabilities. Similarly, we may use the following formula for calculating probabilities for a Poisson random variable X.
Poisson Probability Distribution Formula
If the requirements are met, the probability that a particular event occurs X times within a given interval is
P(X)=μX⋅e−μX!
where
μ=the mean of the Poisson probability distribution
e=a constant approximately equal to 2.718281828
X=the number of occurrences of the event within the interval
EXAMPLE 22Finding probabilities using the Poisson distribution
A study was done of the number of cardiac arrests to occur per week in a particular hospital of 850 beds over a period of 5 years.4 The number of cardiac arrests fulflls the requirements for the Poisson probability distribution and has a mean of μ=1.09 cardiac arrests per week. Calculate the following probabilities:
- The probability of two cardiac arrests in a given week
- The probability of fewer than two cardiac arrests in a week
- The probability of at most two cardiac arrests in a week
- The probability of more than two cardiac arrests in a week
- The probability of at least three cardiac arrests in a week
Solution
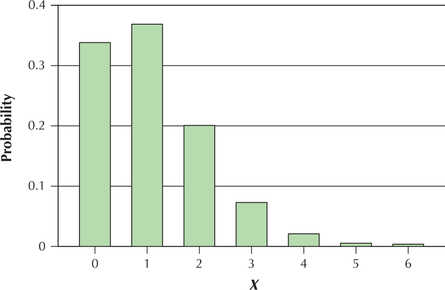
The number of cardiac arrests fulfills the requirements for the Poisson probability distribution, so we may use the Poisson probability distribution formula to calculate the desired probabilities. To use this formula, we must determine the values of μ and . For each of (a)–(e), we have . The Poisson distribution with for is shown in Figure 18.
Here, , so the probability that is
The Poisson distribution is a discrete distribution, so that “fewer than 2” means or . We thus find and , and add the resulting probabilities to arrive at the answer.
So the probability of fewer than two cardiac arrests in a week equals .
The phrase “at most 2” means or or . We thus find , , and and add the resulting probabilities to arrive at the answer. We have already found and from part (b) and have found from part (a). Thus, the probability of, at most, two cardiac arrests in a week equals
Page 344- The phrase “more than 2” means , , and so on to infinity. In Figure 18, these probabilities are represented by the rectangles for , , and so on. Now the Law of Total Probability says that the sum of the probabilities of all values of equals 1. Thus, the probabilities represented by the rectangles for , , and so on equals 1 minus the sum of the rectangles for , , and . In other words, — . We found in part (c). Thus, .
- The phrase “at least 3” means , , and so on to infinity. These are the same -values represented in part (d) by the phrase “more than 2.” Thus, .
NOW YOU CAN DO
Exercises 9–14.
YOUR TURN#11
Suppose the number of customers to a boutique crafts shop follows a Poisson distribution with mean per hour. Find the following probabilities:
- Getting 10 customers in an hour
- Getting 12 customers in an hour
(The solutions are shown in Appendix A.)
3The Mean, Variance, and standard Deviation for a Poisson Distribution
Just as the binomial distribution has a mean, variance, and standard deviation, we can calculate these quantities for a Poisson probability distribution. The mean, variance, and standard deviation for a Poisson distribution are as follows.
Parameters of the Poisson Distribution
EXAMPLE 23Applying the mean and standard deviation
Zillow.com indicated that the number of homes for sale in Storrs, Connecticut, in July 2014 was 25. Suppose that the number of homes for sale in Storrs meets the requirements for the Poisson probability distribution, with mean .
- Calculate the mean, variance, and standard deviation of the number of homes for sale in Storrs.
- Determine which values of X = the number of homes for sale in Storrs would be considered moderately unusual.
Solution
- Mean = . Variance = . Standard deviation = .
Recall from Section 3.4 (page 159) that a data value farther than 2 standard deviations from the mean is considered moderately unusual. The numbers of homes that lie 2 standard deviations above and below the mean are calculated as follows:
Thus, if 15 or fewer homes were sold in Storrs in 1 month, this would be considered moderately unusual. Similarly, it would be moderately unusual if 35 or more homes were sold.
NOW YOU CAN DO
Exercises 15–18.
YOUR TURN#12
Suppose the number of customers to a boutique crafts shop follows a Poisson distribution with mean per hour.
- Calculate the mean, variance, and standard deviation of the number of customers per hour.
- Determine which values of X = the number of customers per hour would be considered unusual.
(The solutions are shown in Appendix A.)
4Using the Poisson Distribution to Approximate the Binomial Distribution
We can use the Poisson distribution to approximate the binomial distribution when the number of trials is large and the probability of success is small, as measured by the following requirements:
Requirements for Using the Poisson Distribution to Approximate the Binomial Distribution
and
where is the number of trials and is the probability of success for the binomial distribution.
If the requirements are met, then the mean of the Poisson distribution used to approximate the binomial distribution is given as
EXAMPLE 24Poisson approximation to the binomial distribution
Two percent of online e-commerce transactions are fraudulent.5 (a) In a sample of 100 online e-commerce transactions, approximate the probability that three fraudulent transactions occur. (b) Measure the accuracy of the approximation.
Solution
We first verify that the requirements are met. The number of trials is . The probability of “success” (that is, fraud) on any particular transaction is , so that . The requirements are met. Next, we find the mean of the Poisson distribution used to approximate the binomial distribution: . Then the probability that fraudulent transactions occur is
Page 346The probability is 0.1804 that three fraudulent transactions occur in the sample of 100 online e-commerce transactions.
- How good an approximation is this? Using the more accurate binomial distribution, we get , meaning that the Poisson approximation is accurate in this instance to within of the binomial probability.
NOW YOU CAN DO
Exercises 19–22.