STEP-BY-STEP TECHNOLOGY GUIDE: t Confidence Intervals
We illustrate how to construct the t confidence interval for Example 16 (page 454).
TI-83/84
If you have the data values:
- Step 1 Enter the data into list L1.
- Step 2 Press STAT, highlight TESTS.
- Step 3 Press 8 (for TInterval, see Figure 22).
- Step 4 For input (Inpt), highlight Data and press ENTER (Figure 23).
- For List, press 2nd then L1.
- For Freq, enter 1.
- For C-Level (confidence level), enter the appropriate confidence level (for example, 0.95), and press ENTER.
- Highlight Calculate and press ENTER. The results are shown in Figure 19 in Example 16.
If you have the summary statistics:
- Step 1 Press STAT, highlight TESTS.
Step 2 Press 8 (for TInterval, see Figure 22).
Page 456- Step 3 For input (Inpt), highlight Stats and press ENTER (Figure 24).
- For x̄, enter the sample mean 185.9375.
- For Sx, enter the sample standard deviation 56.81017368.
- For n, enter the sample size 16 .
- For C-Level (confidence level), enter the appropriate confidence level (for example, 0.95), and press ENTER.
- Highlight Calculate and press ENTER. The results are shown in Figure 19 in Example 16.
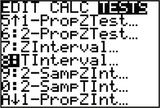 FIGURE 22
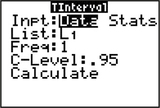 FIGURE 23
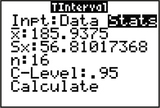 FIGURE 24
EXCEL
If you have the data values:
- Step 1 Enter the data into Column A.
- Step 2 Label C1 through F1 X-bar, Std Err, X-bar – StdErr, and X-bar + Std Err.
- Step 3 Click Data > Data Analysis > Descriptive Statistics. For Input Range, highlight A1 through A16 . Click Summary Statistics, click OK. Note the mean, 185.9375, and standard deviation, 5 6 .81 017.
- Step 4 Click cell C2 and enter the mean, 185.9375.
- Step 5 Click cell D2, and click the Insert Function icon fx. Under Search for a function, type confidence.t. Click Go, and OK.
- Step 6 Enter the Alpha value, 0.01, the Standard_dev, 5 6.81017, and the sample Size 16 . Click OK.
- Step 7 In cell E2, type = C2-D2, and press ENTER. In cell F2, type = C2+D2, and press ENTER. Cells E2 and F2 are your confidence interval. Results are shown in Figure 25.
If you have the summary statistics:
- Step 1 Label C1 through F1 X-bar, Std Err, X-bar – StdErr, and X-bar + Std Err.
- Step 2 Click cell C2 and enter the mean, 185.9375.
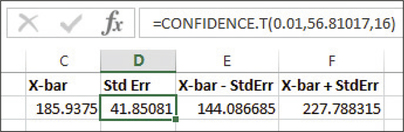 FIGURE 25 Excel results.
 - Step 3 Click cell D2, and click the Insert Function icon fx . Under Search for a function, type confidence.t. Click Go, and OK.
- Step 4 Enter the Alpha value, 0.01, the Standard_dev, 56.81017, and the sample Size 16. Click OK.
- Step 5 In cell E2, type = C2-D2, and press ENTER. In cell F2, type = C2+D2, and press ENTER. Cells E2 and F2 are your confidence interval.
MINITAB
If you have the data values:
- Step 1 Enter the data into column C1.
- Step 2 Click Stat > Basic Statistics > 1-Sample t…
- Step 3 Select One or more samples, each in a column from the drop-down menu. Click the box below the menu, click C1, and click Select.
- Step 4 Click Options…, enter 95 as the Confidence level, and click OK twice.
The results are shown in Figure 20 in Example 16.
If you have the summary statistics:
- Step 1 Click Stat > Basic Statistics > 1-Sample t…
- Step 2 Click Summarized Data from the drop-down menu.
- Step 3 For Sample Size enter 16, for Sample Mean enter 18 5 .9, and for Standard Deviation enter 56.8.
- Step 4 Click Options…, enter 95 as the Confidence Level, click OK, and click OK again.
SPSS
If you have the data values:
- Step 1 Enter the data into the first column. Click Analyze > Descriptive Statistics > Explore…
- Step 2 Move the variable to the Dependent List. Under Display, select Statistics.
- Step 3 Click Statistics…, select Descriptives, and in the box for Confidence Interval for Mean, enter 95. Click Continue, then click OK. The results are shown in Figure 21 in Example 16.
JMP
If you have the data values:
- Step 1 Click File > New > Data Table. Enter the data into Column 1.
- Step 2 Click Analyze > Distribution. Click Column 1 under Select Columns, then click Y, Columns. Click OK.
- Step 3 Click the red triangle beside Column 1, and click Confidence Interval > 0.95. The output is shown in Figure 26.
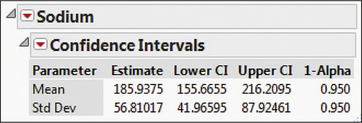 FIGURE 26 JMP results.
Page 457
CRUNCHIT!
If you have the data values:
- Step 1 Click File, then highlight Load from Larose, Discostat3e > Chapter 8, and click on Example 02_17.
- Step 2 Click Statistics, highlight t and select 1-sample.
- Step 3 With the Columns tab chosen, for Sample select Sodium.
- Step 4 Select the Confidence Interval tab, and enter 95 for the Confidence Interval Level (%). Then click Calculate.
If you have the summary statistics:
- Step 1 Click Statistics, highlight t, and select 1-sample.
- Step 2 Choose the Summarized tab. For n enter the sample size 16; for Sample Mean, enter 185.9375. For Standard Deviation, enter 56.8.
- Step 3 Select the Confidence Interval tab, and enter 95 for the Confidence Interval Level (%). Then click Calculate.
[Leave] [Close]