Printed Page 537Menu
STEP-BY-STEP TECHNOLOGY GUIDE: t test for μ
We will use the golden ratio data from Example 21 (page 531).
TI-83/84
If you have the data values:
- Step 1 Enter the data into list L1.
- Step 2 Press STAT, highlight TESTS.
- Step 3 Press 2 (for T-Test; see Figure 34a).
- Step 4 For input (Inpt), highlight Data and press ENTER (Figure 34b).
- For μ0, enter the value of μ0, 1. 618.
- For List, press 2nd, then L1.
- For Freq, enter 1.
- For μ, select the form of Ha. Here, we have a two-tailed test, so highlight ≠ μ0 and press ENTER (Figure 34b).
- Highlight Calculate and press ENTER. The results are shown in Figure 29a in Example 21.
If you have the summary statistics:
- Step 1 Press STAT, highlight TESTS.
- Step 2 Press 2 (for T-Test; see Figure 34a).
- Step 3 For input (Inpt), highlight Stats and press ENTER (Figure 34c).
- For μ0, enter the value of μ0, 1.618.
- For x̄, enter the sample mean 1.583888889.
- For Sx, enter the value of s, 0.1230083158.
- For n, enter the sample size 18.
- For μ, select the form of Ha. Here, we have a two-tailed test, so highlight ≠ μ0 and press ENTER (Figure 34c).
- Highlight Calculate and press ENTER. The results are shown in Figure 29a in Example 21.
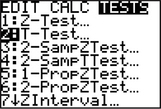 FIGURE 34a
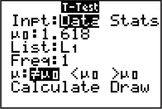 FIGURE 34b
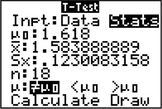 FIGURE 34c
EXCEL
Use the JMP add-in for Excel.
MINITAB
If you have the data values:
- Step 1 Enter the data into column C1.
- Step 2 Click Stat > Basic Statistics > 1-Sample t….
- Step 3 Select One or more samples, each in a column from the drop-down menu, click inside the box under the drop-down menu, and select C1.
- Step 4 Select Perform hypothesis test. For Hypothesized mean, enter 1.618.
- Step 5 Click Options…
- Choose your Confidence Level as 100(1 − α). Our level of significance α here is 0.05, so the confidence level is 95.0.
- Select Mean ≠ hypothesized mean for the Alternative hypothesis.
- Step 6 Click OK and click OK again.
If you have the summary statistics:
- Step 1 Click Stat > Basic Statistics > 1-Sample t.
- Step 2 Select Summarized Data from the drop-down menu.
- Step 3 Enter the Sample size 18, the Sample mean 1.58, and the Standard deviation 0.123. Check Perform hypothesis test, and enter a Hypothesized mean of 1.618.
- Step 4 Click Options…
- Choose your Confidence Level as 100(1 − α). Our level of significance α here is 0.05, so the confidence level is 95.0.
- Select Mean ≠ hypothesized mean for the Alternative hypothesis.
- Step 5 Click OK and click OK again.
SPSS
If you have the data values:
The following is for two-tailed tests only.
- Step 1 Enter the data in the first column.
- Step 2 Select Analyze > Compare Means > One-sample T Test. Move the variable to the Test Variable(s) box.
- Step 3 Enter a Test Value of 1. 618 . Click OK. The p-value is found in the Sig. (2-tailed) box in the One-Sample Test table.
Page 538
JMP
If you have the data values:
- Step 1 Enter the data in the first column.
- Step 2 Select Analyze > Distribution. Move the variable to the Y, Columns box. Click OK.
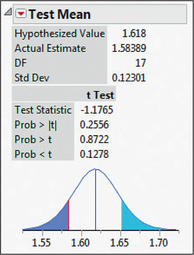
- Step 3 Click the red triangle beside the variable name. Select Test Mean. For Specify Hypothesized Mean, enter 1.618. Click OK. The output is shown in Figure 34d.FIGURE 34d JMP results.
CRUNCHIT!
If you have the data values:
- Step 1 Click File, then highlight Load from Larose, Discostat3e > Chapter 9 and click on Example 04_20.
- Step 2 Click Statistics, highlight t, and select 1-sample. With the Columns tab chosen, for Sample select Ratio.
- Step 3 Select the Hypothesis Test tab. For Mean under null hypothesis, enter 1.618. For Alternative, select Two-sided. Then click Calculate. Results are in Figure 29b in Example 21.
If you have the summary statistics:
- Step 1 Click Statistics, highlight t, and select 1-sample.
- Step 2 Choose the Summarized tab. For n, enter the sample size 18; for Sample Mean enter 1.583. For Standard Deviation, enter 0.123.
- Step 3 Select the Hypothesis Test tab. For Mean under null hypothesis, enter 1.618. For Alternative, select Two-sided. Then click Calculate.
[Leave] [Close]