Printed Page 552(cont.)
STEP-BY-STEP TECHNOLOGY GUIDE: Z test for p
We will use the information from Example 28 (page 548).
TI-83/84
- Step 1 Press STAT, highlight TESTS.
- Step 2 Press 5 for 1-PropZTest (see Figure 42a).
- Step 3 For p0, enter the value of p0, 0.01.
- Step 4 For x, enter the number of successes, 8.
- Step 5 For n, enter the number of trials, 500.
- Step 6 For prop, enter the form of Ha. Here, we have a right-tailed test, so highlight > p0 and press ENTER (see Figure 42b).
- Step 7 Highlight Calculate and press ENTER. The results are shown in Figure 37 in Example 28.
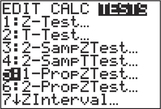 FIGURE 42a
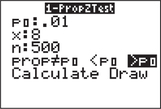 FIGURE 42b
EXCEL
Use the JMP add-in for Excel.
MINITAB
If you have the summary statistics:
- Step 1 Click Stat > Basic Statistics > 1 Proportion… .
- Step 2 Select Summarized Data from the drop-down menu.
- Step 3 Enter the Number of events, 8 and the Number of trials, 500. Select Perform hypothesis test. For Hypothesized proportion, enter 0.01.
- Step 4 Click Options.
- Choose your Confidence Level as 100(1 − α). Our level of significance α here is 0.05, so the confidence level is 95.0.
- Select Proportion > hypothesized proportion for the Alternative hypothesis.
- Select Normal approximation for Method.
- Step 5 Click OK and click OK again. The results are shown in Figure 38 in Example 28.
CRUNCHIT!
If you have the summary statistics:
- Step 1 Click Statistics, highlight Proportion, and select 1-sample.
- Step 2 Choose the Summarized tab. For n, enter the number of trials 500; for Successes, enter 8.
- Step 3 Select the Hypothesis Test tab. For Proportion under null hypothesis, enter 0.01.
- Step 4 For Alternative, select Greater than. Then click Calculate. Results are shown in Figure 39 in Example 28.
[Leave] [Close]