18.6 18.5 How We Grow
A large change of scale forces adaptive changes in materials or form. However, within narrow limits—in most cases, up to a factor of 2—creatures can grow according to geometric similarity. That is, they can grow proportionally, so that their shape is preserved. A striking example of such growth by a far greater factor is the chambered nautilus (Nautilus pompilius). Each new chamber that it adds to its shell is larger than, but geometrically similar to, the previous chamber and also similar to the shape of the shell as a whole—an equiangular, or logarithmic, spiral (see Figure 18.12).
Helping to Find Missing Children 18.4
18.4

What might a 19-day-old child look like 19 years later? The National Center for Missing and Exploited Children (NCMEC), in Arlington, Virginia, uses a computer and a more sophisticated version of the graph-paper technique to answer such questions. Computer age-progression specialists scan photographs of both the missing child and an older sibling or a biological parent at age 19. The face of the missing child is stretched, depending on age, to reflect craniofacial growth, and then merged with the image of the sibling or parent at 19 years old. The result is a rough idea of what the missing child may look like. As mathematicians and biologists refine their models of how faces change over time, this technique will improve. It may even become possible to gain an idea of how a child may look at age 40 or 65.

Carlina White, who was kidnapped at 19 days old, as a teenager began to realize that her “mother” was not her birth mother. Eventually, she contacted the NCMEC, which found three possible matches. In January 2011, at age 23, she was at last reunited with her birth mother, a happy resolution to the longest- known case of abduction by a stranger.
Most living things grow over the course of their lives by a factor greater than 2. We’ve seen with Dimetrodon that a big specimen was not just a scaled-up small one. Nor is a human adult simply a scaled-up baby: A baby’s head is relatively much larger than an adult’s, and its arms are disproportionately shorter. In growth from baby to adult, the body does not scale up as a whole. Different parts of the body scale geometrically, each with a different linear scale factor. That is, a baby’s eyes grow to perhaps twice their original size, while the arms grow by a factor of about 4.

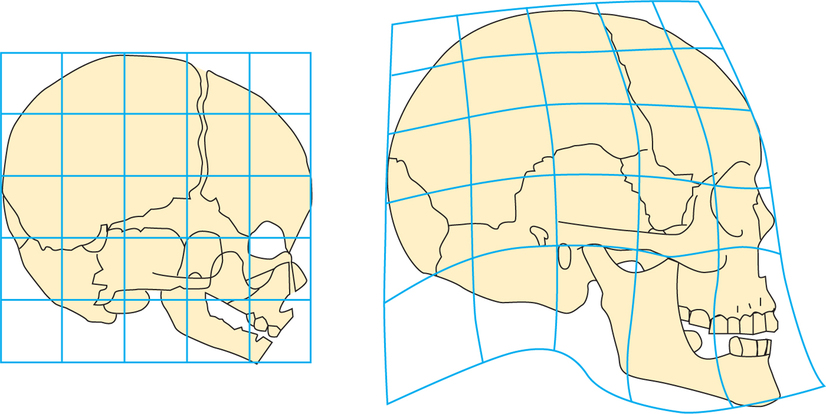
Although the laws for growth can be much more complicated than for proportional growth (or even for the allometric growth that we discuss later), more sophisticated mathematics—for example, differential geometry, the geometry of curves and surfaces—permits analysis of complex and interlocking scalings. For a model of the process in which a baby’s head changes shape to grow into an adult head, we can use graph paper: First, we put a picture of the baby’s skull on graph paper. Then we determine how to deform the grid until the pattern matches an adult skull. (See Figure 18.13 and Spotlight 18.4.) The same idea lies at the heart of computerized “morphing,” the process in which the face of one person can be changed smoothly into the face of another, with different scalings for different parts of the face.
Allometric Growth
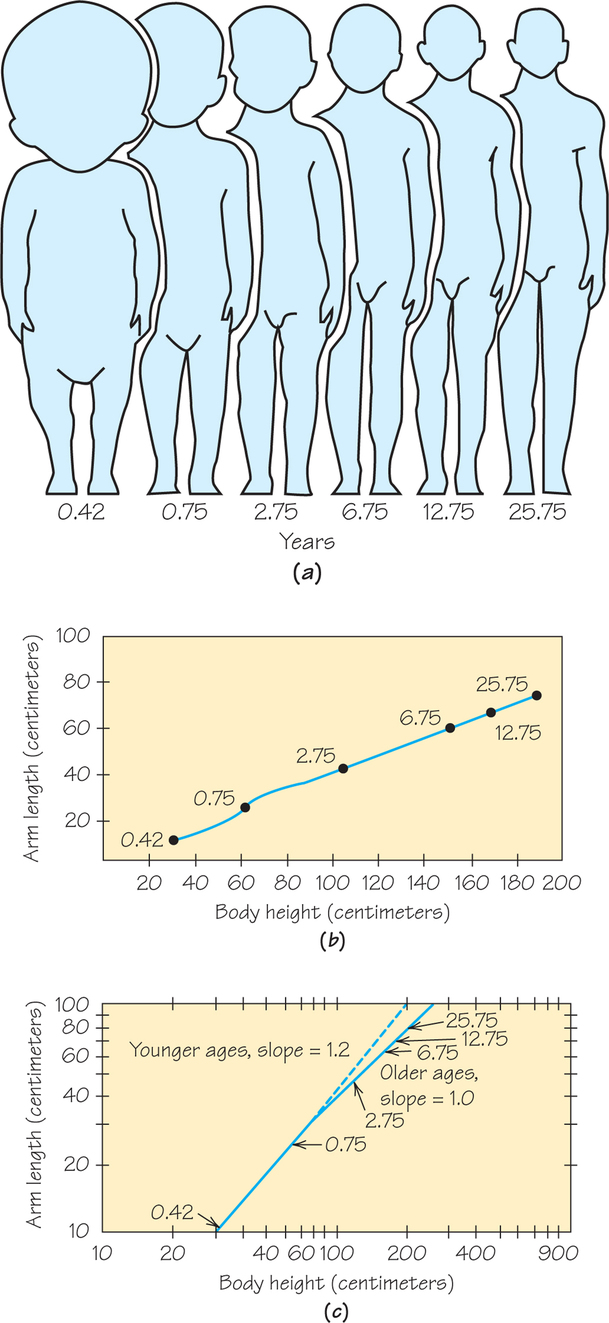
If we measure the arm length or head size for humans of different ages and compare these measurements with body height, we observe that humans do not grow proportionally; that is, in a way that maintains geometric similarity. The head of a newborn baby may be one-third of the baby’s length, but an adult’s head is usually close to one-seventh of the individual’s height. The arm, which at birth is one-third as long as the body, is by adulthood closer to two-fifths as long (see Figure 18.14a).
Graphing provides a way to test for differential growth. We plot body height on the horizontal axis and arm length on the vertical axis (see Figure 18.14b). A straight line would indicate proportional growth—that is, according to geometric similarity. We do get a straight line from 9 months (0.75 years) on up. But up to 9 months, we get a curve, which indicates that the ratio of arm length to height does not remain constant over the first year.

Logarithms
Is there an orderly law by which we can relate arm length to height? Let’s plot again, this time using a different scale (see Figure 18.14c). For this base-10 logarithmic scale, we mark off equal units, as usual. But instead of labeling the marked points with 0, 1, 2, 3, and so on, we label them with the corresponding powers of 10: 100=1, 101=10, 102=100, 103=1000, and so on, which are also called orders of magnitude. This is the procedure that we used to make Figure 18.10 on page 758. In that figure, the fact that the data cling close to a straight line indicates a power-law relationship between metabolic rate and body mass, which would not be obvious if we had graphed using ordinary scales instead of logarithmic scales.
Plotting a point on such a scale is not easy because the point midway between 1 and 10 on the logarithmic scale is not 5.5; rather, it is 101/2≈3. Special graph paper marks smaller divisions and makes points easier to plot; paper marked with log scales on both axes is called log-log paper, while semilog paper has a logarithmic scale on just one axis. Many computer plotting packages can also produce logarithmic scales.
We could use a logarithmic scale for either height or arm length, or for both. When logarithmic scales are used for both, as in Figure 18.14c, the data plot closely to a straight line. Looking carefully at the figure, we can discern actually two different straight lines: a steeper one that fits early development (we will see shortly that it has slope 1.2), and a less steep one (with slope 1.0) that fits development after 9 months of age.
The change from one line to another after 9 months indicates a change in pattern of growth. The pattern after 9 months, characterized by the straight line with slope 1, is indeed proportional growth (sometimes called isometric growth). For the pattern before 9 months, the slope is 1.2. The fact that it is greater than 1 means that arm length is increasing relatively faster than height. This early growth also follows a definite pattern, called allometric growth.
Allometric Growth DEFINITION
Allometric growth is growth of the length of one feature at a rate proportional to a power of the length of another.
In geometric scaling, area grows according to the square (second power), and volume according to the cube (third power), of length, so they grow allometrically with length.
If we denote arm length by y and height by x, a straight-line fit on log-log paper corresponds to the algebraic relation
log10 y=B+a log10 x
where a is the slope of the line and B is the point where the graph crosses the vertical axis. If we raise 10 to the power of each side, we get
y=bxa
where b=10B. This equation describes a power curve: y is a constant multiple of x raised to a certain power.
EXAMPLE 12![]() The Power of Growth
The Power of Growth
How do we arrive at those slopes of 1.0 and 1.2 in Figure 18.14?
You could use statistical software or your calculator to find the equation of the least- squares regression line (as discussed in Section 6.4 on page 260) through the points on the log-log plots. Here, we find approximate values for the slope a for each line from the coordinates of the points at the ends of the lines, for ages 0.42, 0.75, and 25.75. The observations and the corresponding logarithms are as follows:
| Age | Height | Log (Height) | Arm Length | Log (Arm Length) |
|---|---|---|---|---|
| 0.42 | 30.0 | 1.48 | 10.7 | 1.03 |
| 0.75 | 60.4 | 1.78 | 25.1 | 1.40 |
| 25.75 | 180.8 | 2.26 | 76.9 | 1.89 |
The slope for the line from age 0.42 to age 0.75 is the vertical change over the horizontal change in terms of log units:
log 25.1−log 10.7log 60.4−log 30.0=1.40−1.031.78−1.48=0.370.30≈1.2
The slope for the line from age 0.75 to age 25.75 is
log 76.9−log 25.1log 180.8−log 60.4=1.89−1.402.26−1.78=0.490.48≈1.0
So a=1.2 up to 9 months, and a=1.0 after 9 months. Up to 9 months, arm length grows according to (height)1.2. After 9 months, arm length grows according to (height)1.0, and we get y=bx1.0, which is a linear relationship describing proportional growth—that is, growth according to geometric similarity. on ordinary graph paper, proportional growth appears as a straight line and allometric growth as a curve. on log-log paper, both patterns appear as straight lines.
Allometry was used by paleontologists to determine that all specimens (just six!) of the earliest bird, 4rchaeopteryx, are indeed of the same species, and that the puzzling minute fossil fish Palaeospondylus (found only in Scotland) was probably just the larval stage of a better-known fish.
In this chapter, we have explored the limitations on life imposed by dwelling in three dimensions. In Chapters 19 and 20, we will see that dimensionality also imposes surprising limits on artistic creativity in devising patterns.