3.3 3.2 Critical-Path Schedules
In our discussion so far, we have acted as though the priority list used in applying the list-processing algorithm was given to us in advance based on external considerations. Let’s now consider the question of whether there is a systematic method of choosing a priority list that yields optimal or nearly optimal schedules. We show how to construct a specific priority list based on this principle, to which the list-processing algorithm can then be applied.
Management Science and Disaster Recovery 3.1
3.1
The city of New York depends on a public transportation system of subways and roads to bring hundreds of thousands of people who live in the four outer boroughs (Queens, Brooklyn, the Bronx, and Staten Island) into Manhattan to work and “play.” New York city (NYC) also has a communications system of telephones, radio and television stations, and computer networks. These systems speed information between New York’s citizens and people outside the city and around the world. The area in southern Manhattan, in the vicinity of the World Trade Center (WTC), was a center for banking, insurance, financial markets, and domestic and international commerce. The attack on the World Trade Center on September 11, 2001, disrupted these networks and markets but did not destroy them, partly because the principles of operations research and management science were used in the design and development of these systems over a long period of time.
The diagram below shows a very simple subway (train) system between an eastern and a western terminus.
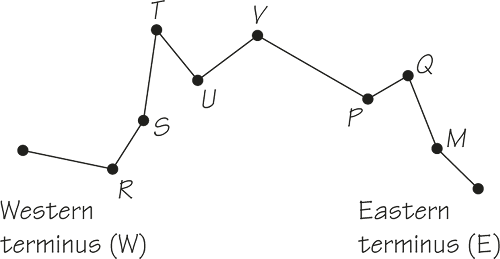
There are two tracks, each dedicated for use by westbound or eastbound trains to run between the two termini. The only place where trains can be turned around is at these termini. Simple graph theory tells us that in such a system, if a vertex is “destroyed” or out of service, or an edge is “destroyed” or out of service, the system totally breaks down. However, the simple provision that trains can be turned around at U, even though this is usually only one stop on the way from W to E, gives much greater flexibility to the system if there is a water main break or a gas leak and so on. Thanks to simple principles of this kind and the creation of routes that use independent lines with many transfer points, New Yorkers were able to use the subway system in a flexible way after the World Trade Center disaster. In the days right after the WTC collapsed, trains were not allowed past the geographic area near the WTC for fear that the tunnels’ structural foundation had been weakened and that subway vibrations could cause the collapse of damaged buildings. After it was ascertained that running the subways was safe, both for partially damaged buildings and for the subways themselves, routes were altered several times to give rescue workers and people returning to their daily routines maximum support. One line’s tunnels did collapse, and several stations had to be closed for extended periods, but due to the redundancy and flexibility of the design of the system, a remarkable amount of service was restored quickly. Recent projects to improve the infrastructure of the NYC subway system are also making it more flexible in dealing with potentially crippling events such as a huge snowfall.
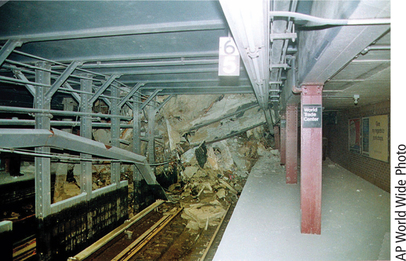
Good planning and wise application of the principles of management science make it possible to minimize the effects of natural and manmade disasters.
Recall from our discussion of critical-path analysis in Chapter 2 that no matter how a schedule is constructed, the finish time cannot be earlier than the length (in terms of weight rather than number of edges) of the longest path in the order-requirement digraph. This suggests that we should try to schedule first those tasks that occur early in long paths, because they might be a bottleneck for the other tasks. This idea leads to critical-path scheduling.
EXAMPLE 3 Scheduling Two Processors
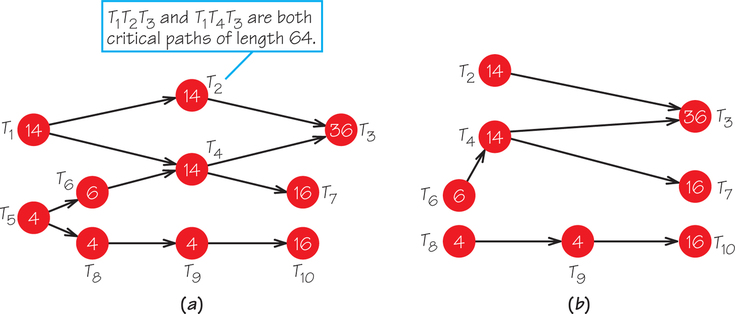
To illustrate this method, consider the order-requirement digraph in Figure 3.10a. Suppose we wish to schedule these tasks on two processors. Initially, there are two critical paths of length 64: T1, T2, T3 and T1, T4, T3. Thus, we place T1, first on the priority list. With T1, “gone,” there is a new critical path of length 60 (T5, T6, T4, T3) that starts with T5, so T5 is placed second on the priority list. At this stage, with T, and T5 removed, we have the residual order-requirement digraph shown in Figure 3.10b. In this diagram, there are paths of length 50 (T2, T3), 56 (T6, T4, T3), 36 (T6, T4, T7), and 24 (T8, T9, T10). Because T6 heads the path that is currently longest in length, it is placed third in the priority list. Once T6 is removed from Figure 3.10b, there is a tie for which is the longest path remaining, because both T2, T3 and T4, T3 are paths of length 50.
When there is a tie between two longest paths, we place next on the priority list the lowest-numbered task heading a longest path. In the example shown here, this means that T2 is placed next on the priority list, to be followed by T4. Continuing in this fashion, we obtain the priority list T1, T5, T6, T2, T4, T3, T8, T9, T7, T10. Note that the order of T7 and T10 was decided using the rule for breaking ties. The list-processing algorithm is now applied using this priority list and the order-requirement digraph in Figure 3.10a. We obtain the schedule in Figure 3.11.

Critical-Path Scheduling PROCEDURE
The critical-path scheduling algorithm applies the list-processing algorithm using the priority list L obtained as follows:
- Find a task that heads a critical (longest) path in the order-requirement digraph. If there is a tie, choose the task with the lower number.
- Place the task found in Step 1 next on the list L. (The first time through the process, this task will head the list.)
- Remove the task found in Step 1 and the edges attached to it from the current order-requirement digraph, obtaining a new (modified) order-requirement digraph.
- If there are no vertices left in the new order-requirement digraph, the procedure is complete; if there are vertices left, go to Step 1.
This procedure will terminate when all the tasks in the original order-requirement digraph have been placed on the list L.
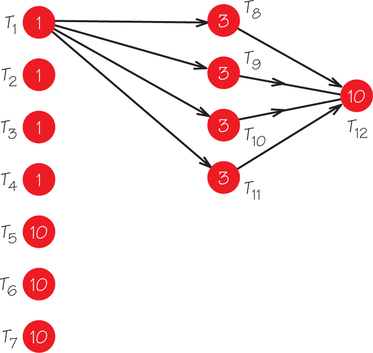
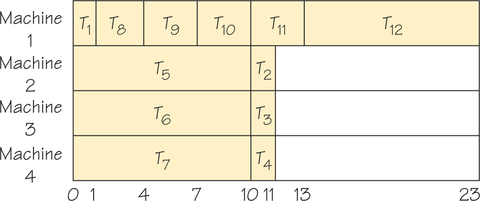
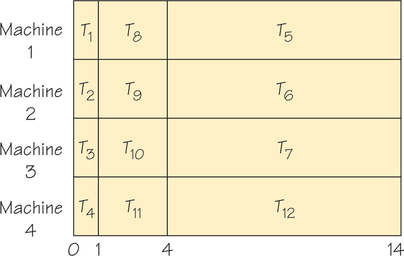
The preceding example shows that critical-path scheduling can sometimes yield optimal solutions. Unfortunately, this algorithm does not always perform well. For example, the critical-path method employing four processors applied to the order-requirement digraph shown in Figure 3.12 yields the list T1, T8, T9, T10, T11, T5, T6, T7, T12, T2, T3, T4 and then the schedule in Figure 3.13. (Note that T5, T6, T7 are thought of as heading paths of length 10.) In fact, there can be no worse schedule than this one. An optimal schedule is shown in Figure 3.14.
Many of the results we have examined so far are negative because we are dealing with a general class of problems that defy our using computationally efficient algorithms to find an optimal schedule. But we can close on a more positive note. Consider an arbitrary order-requirement digraph, but assume all the tasks take equal time. It turns out that we can always construct an optimal schedule using two processors in this situation. Ironically, we can choose among many algorithms to produce these optimal schedules. The algorithms are easy to understand (though not easy to prove optimal) and have all been discovered since 1969! Many people think that mathematics is a subject that is no longer alive, and that all its ideas and methods were discovered hundreds of years ago—but as we have just seen, this is not true. In fact, more new mathematics has been discovered and published in the last 30 years than during any previous 30-year period. This new mathematics typically results in new applications (better telecommunications, medical care, etc.), leading to better lives for everyone.