GT.3 Mapping Earth
Use the geographic grid coordinate system to identify locations on Earth’s surface and distinguish among different types of maps often employed in physical geography.
Maps and mapping technology visually represent the physical world. To be effective, maps must be precisely fixed in real geographic space. The geographic grid coordinate system is one of the systems that can be used to accomplish this.
precipitation
Falling rain, snow, sleet, or hail.
The Geographic Grid
Try telling someone how to get to your house without using street names and addresses. It would not be easy. It would be just as difficult to communicate where things are on Earth’s surface without the geographic grid.The geographic grid is a coordinate system that uses latitude and longitude to identify locations on Earth’s surface. Like a home address, the geographic grid pinpoints any location on Earth’s surface.
geographic grid
The coordinate system that uses latitude and longitude to identify locations on Earth’s surface.
Latitude
As we have seen, Earth rotates on an imaginary axis that runs through both poles. With the North Pole up, Earth rotates eastward parallel to lines of latitude. Latitude is the angular distance as measured from Earth’s center to a point north or south of the equator. The equator is the line of latitude that divides Earth into two equal halves. The equator is exactly perpendicular to Earth’s axis of rotation, and it creates the Northern Hemisphere and the Southern Hemisphere (Figure GT.16).
latitude
The angular distance as measured from Earth’s center to a point north or south of the equator.
equator
The line of latitude that divides Earth into two equal halves. The equator is exactly perpendicular to Earth’s axis of rotation.
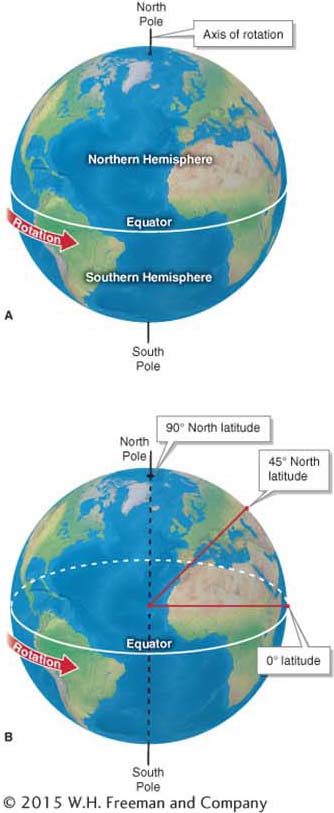

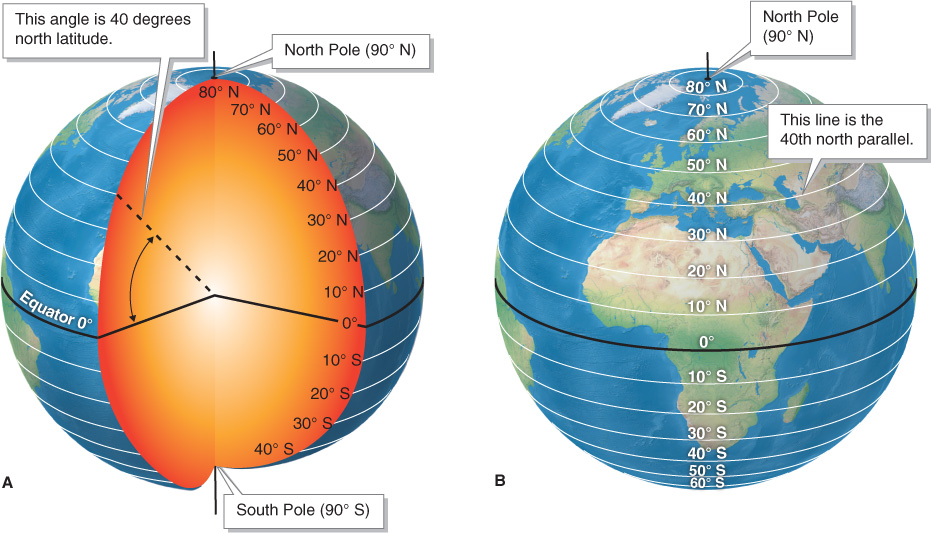
Points of the same latitude connected together form a line called a parallel. Latitude is the name of the angle; parallel is the name of the line. Parallels are imaginary circles that run parallel to the equator and are named for their latitude; for example, a parallel at 40 degrees north is called the 40th north parallel (Figure GT.17).
parallel
A line that forms a circle on the globe by connecting points of the same latitude.
Latitude is given in degrees (°), minutes (‘), and seconds (”). Each degree is divided into 60 minutes. Each minute is divided into 60 seconds. Degrees of latitude are approximately 111 km (69 mi) apart, minutes are 1.9 km (1.2 mi) apart, and seconds are 31 m (102 ft) apart.
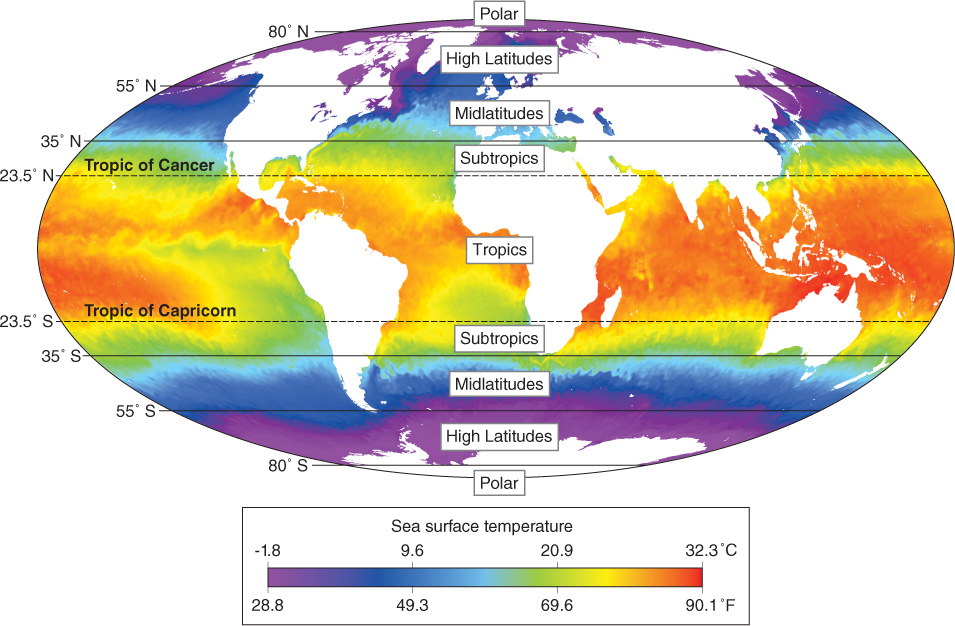
Latitudes are often divided into three major zones: the tropics, midlatitudes, and high latitudes. The tropics are the geographic region located between 23.5 degrees north and south latitude. Midlatitudes and high latitudes are less well defined, but generally are divided at the 55th parallel. Besides these three major zones of latitude, geographers often use two subzones—
tropics
The geographic region located between 23.5 degrees north and south latitude.
Longitude
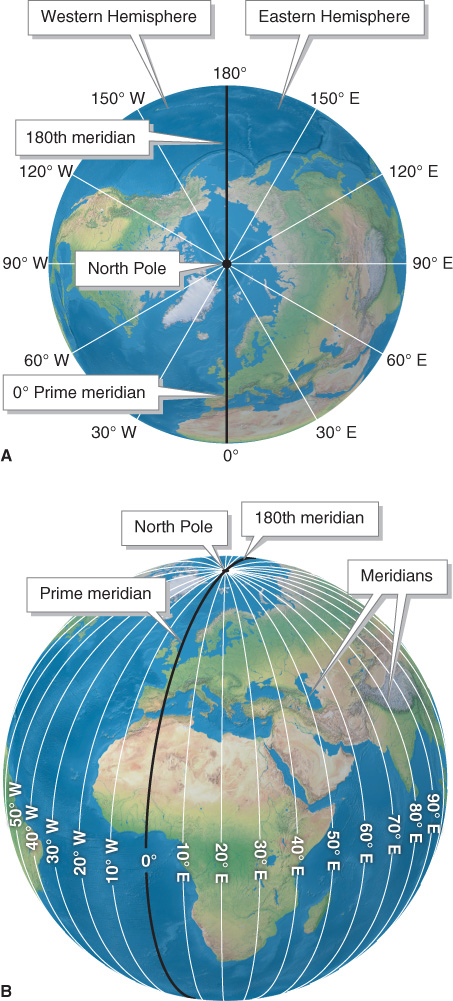
Longitude is the angular distance as measured from Earth’s center to a point east or west of the prime meridian.The prime meridian is the counterpart to the equator—
longitude
The angular distance as measured from Earth’s center to a point east or west of the prime meridian.
prime meridian
Zero degrees longitude; the line of longitude that passes through Greenwich, England, and serves as the starting point from which all other lines of longitude are determined.
As with latitude and parallels, meridians are the counterpart to longitude. A meridian is a line that runs from the North Pole to the South Pole and connects points of the same longitude, as shown in Figure GT.19. Meridians are central to the development of world time zones.
meridian
A line on the globe that runs from the North Pole to the South Pole and connects points of the same longitude.
Like latitude, longitude is given in degrees (°), minutes (’), and seconds (”). Each degree is divided into 60 minutes. Each minute is divided into 60 seconds. The distance between longitudes varies depending on the latitude. Meridians on the equator are 111 km (69 mi) apart. Because meridians all converge at a single point at the poles, there is zero distance between them at the poles, as shown in the quick-
|
LATITUDE |
DISTANCE (KM) |
DISTANCE (MI) |
|---|---|---|
|
0° |
111 |
69 |
|
30° |
96 |
60 |
|
60° |
56 |
35 |
|
90° |
0 |
0 |
Using the Geographic Grid
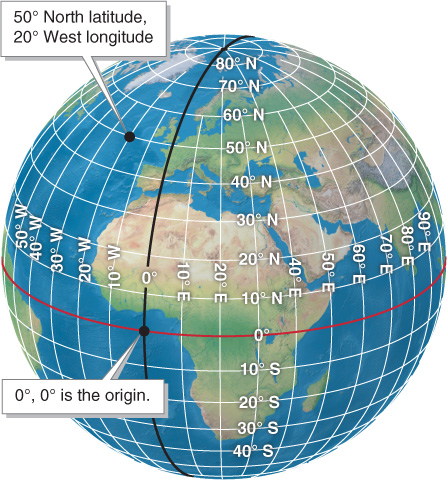
Parallels and meridians together make up the geographic grid system. Geographic grid coordinates always give latitude first, followed by longitude. As an example, the coordinates for Mt. Whitney in California, the highest point in the continental United States, are 36°34’42” N, 118°17’32” W. This set of coordinates reads: “Thirty-
Alternatively, decimal degrees are often used instead of minutes and seconds. With this approach, minutes and seconds are converted to decimals. The above coordinates for Mt. Whitney in decimal degrees are 36.57857°, −118.29225°. The Northern Hemisphere and Eastern Hemisphere are given in positive numbers; the Southern Hemisphere and Western Hemisphere are given in negative numbers. A decimal degree value of five decimal places, as given in the example above, is accurate to about 1 m (3.3 ft).
When finding your way on the geographic grid, start on the origin (at 0°, 0°). From the origin, first find the latitude, then find the longitude (Figure GT.20).
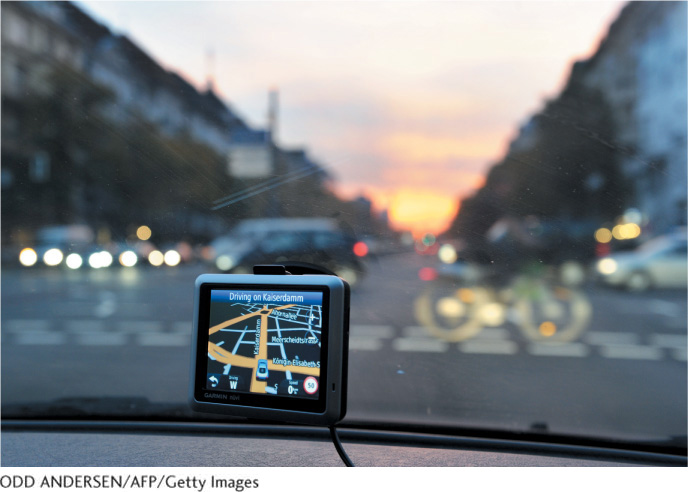
The latitudes and longitudes together create an x–y coordinate system that can be used to locate any point on the planet precisely. The GPS system is what enables our cars and phones to identify our location on Earth (Picture This).
Picture This
The Global Positioning System
Question 901.5
How do my car and phone know where I am?
Cars and smartphones know where on Earth we are because their built-
Not long ago, if we got lost while driving, our options were to use a paper map or ask somebody for directions to get our bearings. Now there are navigation systems that pinpoint our location and provide directions as we are driving. These systems use the Global Positioning System (GPS), a global navigation system that uses satellites and ground-
Global Positioning System (GPS)
A global navigation system that uses satellites and ground-
Consider This
Question 901.6
How does the geographic grid relate to GPS?
Question 901.7
When was the last time you used GPS? What did you use it for?
Maps
Cartography is the science and art of map making. Maps are the most efficient means of communicating spatial information, and they are central to geographic inquiry. Maps used in physical geography portray spatial relationships among objects, geographic regions, or physical phenomena such as rainfall or earthquakes. All maps reduce the size of geographic space onto the map’s surface.
cartography
The science and art of map making.
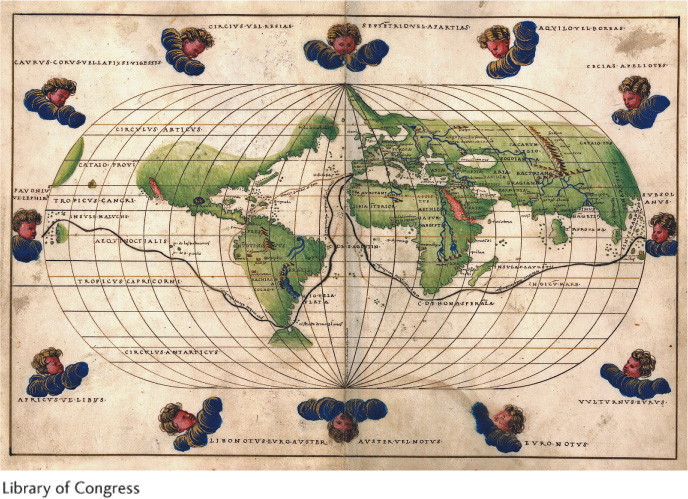
All maps have a purpose. Early maps were often used as an aid to navigation, as shown in Figure GT.21. Modern maps continue to portray Earth’s features, but they also have far more complex functions. Rather than being limited to showing the shapes and features of Earth’s physical surface, physical geography maps portray the current and future state of Earth’s physical systems to the best of our scientific understanding.
Maps are now widely available to the public with the advent of GPS technology in cars and digital maps available through online services such as Google Maps. Maps are traditionally printed on a flat surface such as paper, but spatial information can also be represented on computer screens, in spoken description, or in Braille.
Maps also provide factual information. Statistical and quantitative information, such as population numbers, temperature averages, atmospheric pressure differences across a region, or tornado frequency in the midwestern United States, can be effectively portrayed on maps.
The term map is also applied to concepts such as the “map of the human genome” or a “computer network map.” These are not maps in a geographic sense, however, because they lack a relationship to geographic space.
It is important to keep in mind that Earth’s surface is curved, but maps are flat. Depicting the curved surface of Earth on the flat surface of a map creates distortions of the shape and area of continents. Many different map projections are used to correct for this problem. Map projections are explored further in Appendix 2.
Cartographic distortion on a world map becomes obvious when routes of long-
great circle
A continuous line that bisects the globe into two equal halves, such as the equator; it is the shortest distance between two points on Earth.
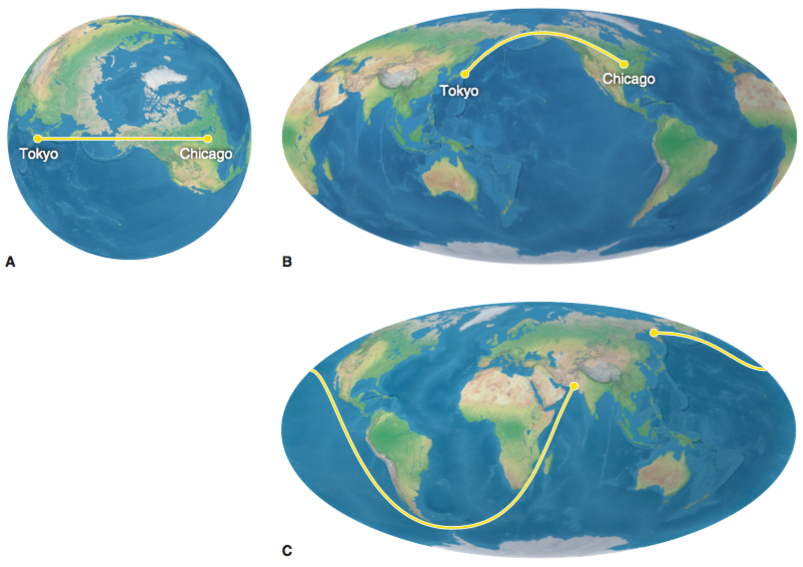
Small circle routes are not straight lines, and they do not bisect the globe into two equal halves. A small circle is a continuous line that forms a circle smaller than the equator. All parallels other than the equator form small circles on the globe. The equator is the only great circle parallel. All meridians are half of a great circle, and when two opposing meridians are combined, they create a great circle.
Map Scale: How Far Is It?
Maps always shrink real-
map scale
A means of specifying how much the real world has been reduced on a map.
Types of Map Scales
There are three different types of map scales: bar scale, verbal scale, and representative fraction scale.
Bar scale (or graphic map scale): A bar scale uses a simple line segment to depict real-
Verbal scale: Verbal map scales are also intuitive to use. A verbal scale works through a written statement such as “one inch represents one mile.” It is easy to measure or estimate an inch on a map.
Representative fraction scale: A representative fraction scale uses real-
For a map to be effective, it should have a map scale. Maps should also have several other elements that increase their effectiveness and reliability, such as a title, legend, direction arrow, and date (Picture This).
Picture This
Map Elements
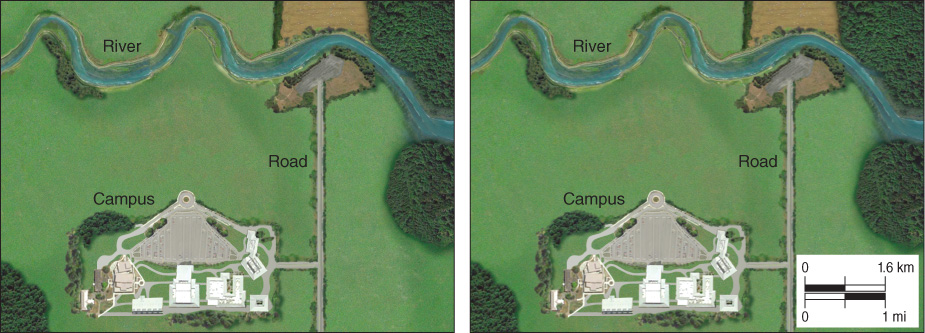
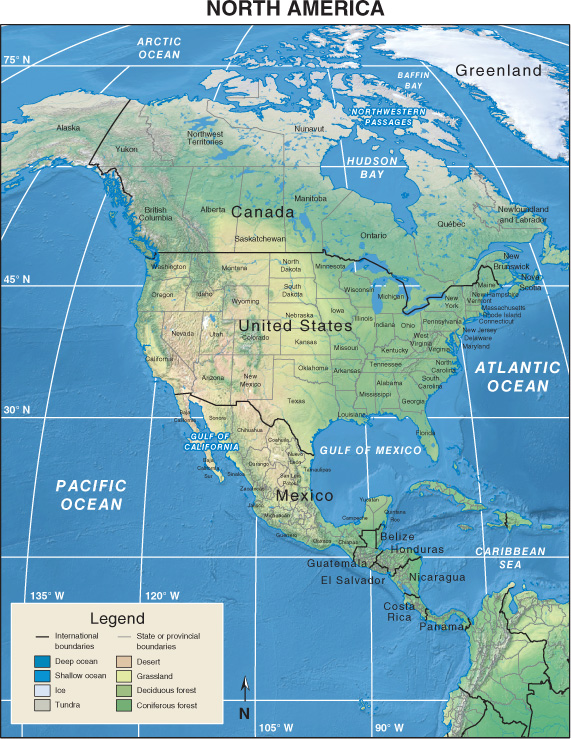
Maps often have several basic elements. Looking at the map at left, find the following elements:
Question 901.8
Title: The map title summarizes the thematic content of the map. “Vegetation of California,” “Arctic Sea Ice, September 2014” would be examples of map titles.
Question 901.9
Map scale: Map scale is required for understanding real-
world distances on a map. Question 901.10
Legend: Maps often use symbols and colors to represent data. This information must be clarified in a map’s legend so the reader can accurately interpret the data. The colors in this map represent elevation, and the legend at the lower left specifies the elevation represented by each color.
Question 901.11
Direction: North is usually “up” on a map, but not always. A large-
scale map of an unfamiliar location should have a north arrow, or it should have the lines of the geographic grid. This is particularly important when north is not at the top of the map. These elements allow the readers to orient themselves. Question 901.12
Date: The date when the map was published, or when the data used in the map were generated, is required for knowing whether the map is current and for identifying updates. For example, a map of Arctic sea ice would be meaningless without a date because the extent of ice changes seasonally and year by year.
Consider This
Question 901.13
What is the title of this map?
Question 901.14
Are all of the map elements listed here found on this map? If not, which ones could you not find?
Lines on the Map: Contour Lines
Topography, the shape and physical character of Earth’s surface, is one kind of information that is often portrayed on maps. A common method of representing topography on a topographic map is by using contour lines, which are lines of equal elevation in relation to sea level. The increment between contour lines is called the contour interval. Figure GT.24 provides an example of the use of contour lines. (Also see Appendix 3.)
topography
The shape and physical character of Earth’s surface.
contour lines
Lines of equal elevation in relation to sea level used on a topographic map.
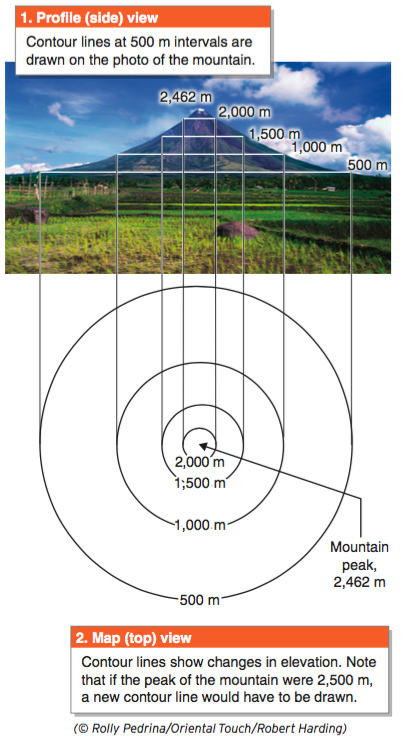
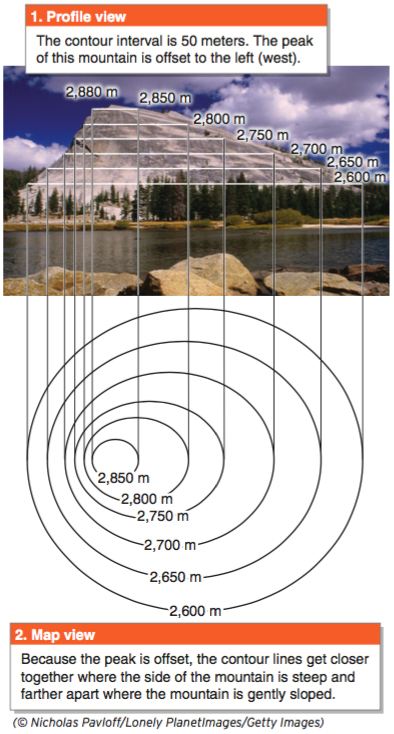
Very few topographic features are as symmetrical as the mountain in Figure GT.24. Most landscapes have more complex and irregular shapes. When uneven topographies appear on a topographic map, the spacing between contour lines reflects the steepness and irregularities of the terrain, as portrayed in Figure GT.25.
Contour lines always connect back to themselves, forming a closed loop. Topographic maps often do not show this, however, because the lines are cut off by the edges of the map. Anywhere on Earth, if you walked on the ground along a contour line, you would eventually wind up where you started. Contour lines converge only on vertical cliffs, and they never cross each other.