10.3 Direct Price Discrimination II: Segmenting/Third-Degree Price Discrimination
When to Use It Segmenting/Third-Degree Price Discrimination
The firm has market power and can prevent resale.
The firm’s customers have different demand curves.
The firm can directly identify specific groups of customers with different price sensitivities (but not the demand of every individual customer) before purchase.
segmenting (third-
A type of direct price discrimination in which a firm charges different prices to different groups of customers.
Because it’s rare for a firm to have the kind of comprehensive information about customers that it needs to practice perfect price discrimination, a firm can’t generally capture all of the market surplus using price discrimination. But it can still earn more profit than a regular monopoly by using a pricing strategy called segmenting (or third-
For this kind of pricing strategy to work, the company must be able to directly identify groups of customers—
Think about a company that sells a clothing line emblazoned with your school logo. If the company knows that students typically don’t have a lot of money and tend to be bargain hunters while their parents are less price-
As with all forms of price discrimination, however, the company must be able to prevent resale. They can’t sell school sweatshirts at a student discount just to have the students then turn around and sell them to visiting parents for less than the higher price these groups would be charged. As a practical matter, if such resales became a problem, the company could institute a quota that would limit the number of sweatshirts a student could buy. Limiting resale is critical to price discrimination.
386
The Benefits of Segmenting: A Graphical Approach
If a firm is able to engage in segmenting, how different should the prices be across the groups, and how much does the company stand to gain by price-

To answer these questions, let’s consider an example with two consumer groups, the market for entry into the prestigious Ironman 70.3 Cozumel Triathlon. This triathlon is a race that comprises a 1.2-
There are two kinds of people who want to enter the Ironman Cozumel: people who live near Cozumel, and people who fly in from somewhere else. The two groups’ demand curves for entering the race are shown in Figure 10.4. Panel a shows the demand (DT) for the participants traveling to Cozumel for the competition. The travelers mostly come from the United States; have high incomes and expensive triathlon equipment; and will have to pay for a plane ticket, a hotel room, food, and a rental car. They don’t care if the price of their registration for the race is a bit higher, because it’s a small share of the total cost to them. In other words, the demand curve for the traveling participants is fairly inelastic.
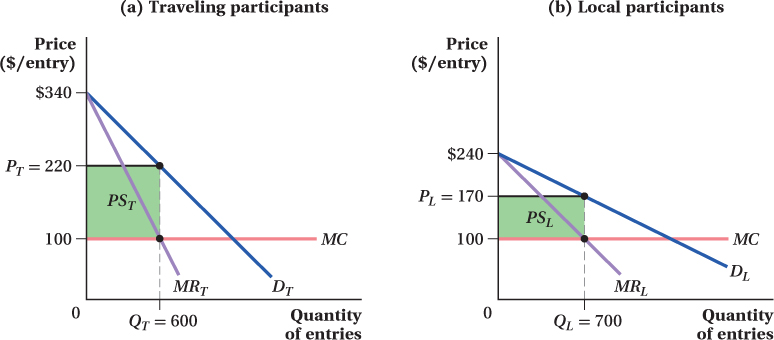
(b) Local participants have a relatively elastic demand curve DL. A greater number of locals will register for the triathlon (QL = 700) at a lower price (PL = $170/entry). Producer surplus for locals, PSL, is relatively small.
387
Panel b of the figure shows the local group’s demand curve, DL. The local residents’ demand is more price-
Preventing resale won’t be a problem for the firm organizing the race as long as it can tell which athletes are from out of town and which are not. This is easy because out-
The fundamental economic idea of segmenting is simple. If a firm can directly identify groups that have different demands and charge different prices to each, it can essentially treat each group as a separate market. The firm then sets its profit-
Let’s see how the organizers of the Ironman Cozumel competition follow the segmenting strategy. The organizers have identified these two different demand curves and treat each as a separate market. From the demand curve of out-
The organizers go through the same process for the local entrants. These entrants’ demand curve DL in panel b implies a marginal revenue curve MRL. The optimal number of entries for the organizer to offer to locals is QL = 700, the quantity at which marginal revenue from locals equals marginal cost. (The marginal cost is the same for either type of racer. It amounts, basically, to the cost of a bib, some extra Gatorade, some water, a finisher’s medal, and a race T-
That’s all there is to the strategy. As long as a seller can keep people from sneaking into the lower-
A firm following this pricing strategy will not earn as much producer surplus as one using perfect price discrimination (which would allow it to take the entire surplus from the market). However, it will earn more surplus than if it acted like a regular monopoly and charged the same price to everyone, because the strategy gives the firm some ability to charge a higher price to consumers with relatively inelastic demand and lower prices to consumers with relatively elastic demand.
Figure 10.5 shows the total Ironman Cozumel demand and marginal revenue that would face a monopolist forced to set only a single price. As in Chapter 5, we calculate the market demand as the horizontal sum of the participants’ demand curves—
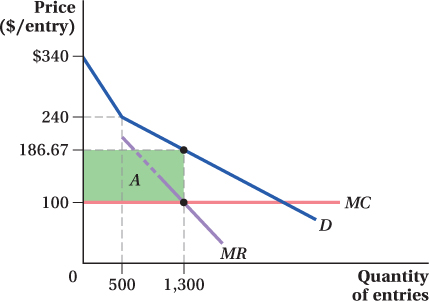
A single-
388
The Benefits of Segmenting: A Mathematical Approach
To do the same analysis of segmenting using mathematics, we start with the two distinct demand curves for the Ironman Cozumel. The demand curve of the traveling participants is given by QT = 1,700 – 5PT, and the locals’ demand curve is QL = 2,400 – 10PL. Note that, in accordance with our story, the locals’ quantity demanded is more sensitive to price than the travelers’ quantity demanded: A $1 increase in the entry fee reduces the number of local entrants by 10, while it only decreases the number of traveling entrants by 5. We assume the marginal cost to the organizer of adding another triathlete to the race is a constant $100, no matter how many entrants there are.
The mathematical analysis of segmenting is done using the same steps as in the graphical analysis above. If the race organizers can identify the separate groups and prevent resale, they can compute the marginal revenue curves for each segment and solve for the monopoly prices separately for each group.
We can follow the methods discussed in Chapter 9 to find the marginal revenue curves from linear demand curves. First, we determine the inverse demand curves by rearranging the demand function to express price in terms of quantity demanded. Doing so gives us the following equations:
| For travelers: | For locals: |
| QT = 1,700 – 5PT | QL = 2,400 – 10PL |
| 5PT = 1,700 – QT | 10PL = 2,400 – QL |
| PT = 340 – 0.2QT | PL = 240 – 0.1QL |
Next, we know that the marginal revenue curve will look like the inverse demand curve, but the coefficient on quantity will be twice as large. The marginal revenue curves for the two segments are
| For travelers: | For locals: | |
| MRT = 340 – 0.4QT | and | MRL = 240 – 0.2QL |
389
The organizers want to sell the quantities at which marginal cost ($100, the same for both groups of triathletes) equals its marginal revenue. Setting each marginal revenue equation above equal to marginal cost tells us the optimal number of entrants from each group:
| For travelers: | For locals: |
| MRT = MC | MRL = MC |
| 340 – 0.4QT = 100 | 240 – 0.2QL = 100 |
| 240 = 0.4QT | 140 = 0.2QL |
| Q*T = 600 | Q*L = 700 |
The last step is to find the entry fees that correspond to these quantities by plugging the quantities back into the inverse demand curve:
| For travelers: | For locals: |
| P*T = 340 – 0.2Q*T | P*L = 240 – 0.1Q*L |
| = 340 – 0.2(600) | = 240 – 0.1(700) |
| = 340 – 120 | = 240 – 70 |
| = $220 | = $170 |
Therefore, in a segmentation strategy, the race organizers sell 600 entries to out-
The total producer surplus the organizers earn is the difference between the price and the marginal cost for each segment times the number of entries sold to that segment. In Figure 10.4, those surpluses are rectangles PST for the segment of nonlocal triathletes and PSL for the local triathletes. Using the results we computed above, we have
| For travelers: | For locals: |
| PST = (220 – 100) × 600 | PSL = (170 – 100) × 700 |
| = 120(600) | = 70(700) |
| = $72,000 | = $49,000 |
for a combined producer surplus of $121,000 to the race organizer.
In our graphical analysis, we contended that the price-
First, we can see that the marginal cost curve intersects demand at the part of the demand curve below the kink—
Q = 1,700 – 5P + 2,400 – 10P = 4,100 – 15P
The inverse demand curve at this intersection is then 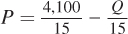 , and the marginal revenue curve has twice the slope, or
 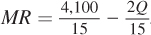 . We set MR equal to the marginal cost to solve for the optimal number of participants under the single-
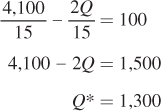
390
Note that 1,300 is exactly the sum of the local and traveling participants under the previous pricing system. Single-
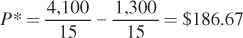
Thus, although locals face a slightly higher price, the travelers get a bargain relative to the segmented outcome.
To calculate the producer surplus, we find the area of the rectangle A in Figure 10.5:
PS = (186.67 – 100) × 1,300
= 86.67(1,300) = $112,671
If the monopolist organizers segment the market for triathlon entries, they earn $121,000 in producer surplus; if they must charge a single price, they earn $112,671. Just by segmenting the market, the monopolist organizers can increase their producer surplus by $8,329, or about 7%.
How Much Should Each Segment Be Charged?
Because the standard market power pricing rule applies in each segment, it also means that the Lerner index, the basic markup formula we derived in Chapter 9, applies in each market. Recall that this formula relates the price elasticity of demand to the markup of price over marginal cost:
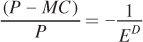
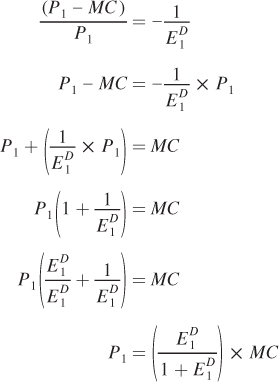
If the firm sells the same good to both segments of the market, the marginal cost of producing for each segment is the same. In this case, the only reason to charge different prices to customers in different segments is because they have different demand elasticities. To see what the Lerner index implies for the ratio of the prices in the two segments (label them 1 and 2), first solve the Lerner index for price in each segment:
391
Likewise,
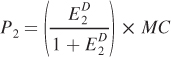
Now, we can compute the ratio of these prices:
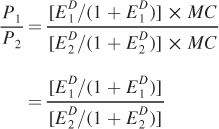
As the demand in Segment 1 becomes less elastic relative to Segment 2 (i.e., E1D becomes smaller than E2D in absolute value), the ratio P1/P2 will rise. That is, the greater the difference in price sensitivities between the segments, the greater should be the ratio in their prices.
Returning to our Ironman Cozumel example, suppose we know that the elasticity of demand for travelers is –1.83 and the elasticity for locals is –2.43.3 We can immediately determine what the ratio of prices should be by plugging these elasticities into the formula:
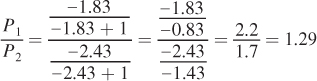
In other words, the race organizer should set the price travelers face to be almost 1.3 times (i.e., 30% higher than) the price for locals. This is, in fact, the ratio between the $220 and $170 optimal entry fees we computed earlier.
make the grade
Is it really price discrimination?
We mentioned this before, but it bears repeating: Always be careful about the distinction between price discrimination, when firms charge different prices for the same product, and price differences. It’s often surprisingly hard to tell them apart. Prices can differ across different customer groups if a firm with market power price-
For example, a bottle of Coca-
The only way to tell the difference between price discrimination and price differences due to costs in competitive markets (without actually being able to observe the firm’s marginal cost) is to find something that changes the price elasticity of demand without changing the cost. Price discrimination implies that a firm with market power sets its price based on the elasticity of demand and the marginal cost of producing. Price in a competitive market depends only on marginal cost. (This is related to the distinction we discussed in Chapter 9 about how firms with market power react differently than competitive firms to rotations in demand.)
392
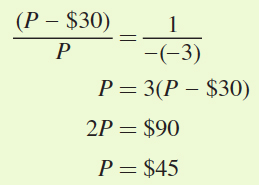
figure it out 10.2
You manage a hair salon that has two locations: one in a large city in Ohio with several competing salons, and another in a small city in Pennsylvania with less competition. In Ohio, your customer’s price elasticity of demand is –3, while for your Pennsylvania customers it is –2. Assume that the marginal cost of producing a haircut is $30 regardless of location.
What are your salon’s optimal markups and prices in each location?
Why do they differ?
Solution:
The Lerner index provides us with a formula for seeing the relationship between pricing and the price elasticity of demand:
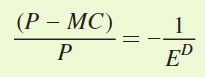
Substituting for marginal cost (= $30) and the price elasticity of demand for Ohio customers (= –3), we get
Repeating the same steps for Pennsylvania gives
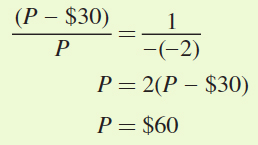
Customers in Ohio will be charged a price of $45 per haircut, while those in Pennsylvania will be charged a price of $60 per haircut.
Because demand is relatively more elastic in Ohio than in Pennsylvania (the absolute value of the price elasticity of demand is greater), customers in Ohio are more price-
sensitive. Therefore, they will be charged a lower price.
Ways to Directly Segment Customers
There are many ways firms directly identify customer segments for the purposes of price discrimination. Here are some of the most common ones.
By Customer Characteristics Firms sometimes price according to customer characteristics such as age (e.g., senior citizen discounts at the movies or child discounts at a hotel), gender, or whether the customer is a student or local resident. The basic idea remains to identify the more price-
Segmenting can even be based on the user’s species. Doctors and veterinarians sometimes use the same medicines. Drug makers recognize that Grandma’s willingness to pay for the arthritis medication Lodine probably well exceeds someone’s willingness to purchase Lodine for her arthritic dog Rover (and not only because Grandma’s savings are larger than Rover’s collection of buried rawhides). This difference in willingness to pay probably explains why a congressional investigation found that the price of Lodine for humans was almost three times higher than for dogs. Indeed, it determined that manufacturers priced almost every comparable medication significantly higher for people than for animals.4
Customer characteristics can also apply to firms or other corporate organizations in business-
393
FREAKONOMICS
Victoria’s Not-
Sometimes price discrimination can end up being costly not just to consumers, but also to producers. In 1996 Denise Katzman of New York City sued Victoria’s Secret for gender discrimination and asked for millions of dollars in damages. In alleging gender discrimination, Katzman didn’t object to the catalog’s pages of scantily clad women. Rather, she pointed to the promotional coupon on the catalog’s back page.
The problem? While Katzman’s catalog offered her $10 off an order of $75, an almost identical catalog for a male friend offered $25 off the same amount. Was her catalog out of date? Nope. The folks at Victoria’s Secret were just engaging in a little “naked” price discrimination.
Although the company kept its reasons for the different promotions a secret, we can speculate on why it might employ such price discrimination using our economics reasoning. We know that price discrimination occurs when a company uses its market power to charge higher prices to people who are willing to pay more. In this case, Victoria’s Secret recognized that its practice of sending out catalogs gave it the opportunity to segment its customers and advertise different prices to different types of customers. Women might be willing to purchase $75 of fancy underwear for a price of $65, but men are probably not as willing to shell out that kind of money for underwear for their wives or girlfriends. They might only pay $50 for the same order. Because most people don’t end up reading through their friends’ catalogs, this form of price discrimination could easily go undetected.
Katzman never did collect her millions in damages, however. The judge sanctioned her lawyer for filing a frivolous suit, ordering him to pay some of the Victoria’s Secret legal fees. Not faring much better was Katzman’s fellow New Yorker, Roy Den Hollander. In 2007 he brought suit against bars that sponsor Ladies’ Nights, which Hollander termed “invidious.” He lost his suit, and bars everywhere continue to advertise gender-
By Past Purchase Behavior Consumers reveal a lot about their willingness to pay when they buy other products, and many sellers use that information to segment customers. In industries like auto insurance or direct-
For some other products, the price sensitivity of new customers is lower than that of past purchasers. For example, it is notoriously difficult to convince people to upgrade their software to a new version. When Microsoft releases a new version of Windows, the price of upgrading an older version is typically much lower than buying the new version outright. With this low price, Microsoft is trying to entice the more price-
By Location Customers living in one area may have a hard time getting to another to take advantage of a lower price, or they might not even have knowledge of the prices in other locations. This often allows sellers to charge different prices in different locations, depending on the price sensitivity of local demand. For example, chain restaurants often charge higher prices at their airport locations than at their other stores, at least in part because travelers in a hurry, in an unfamiliar city, and (often) on an expense account tend not to be price-
394
Application: Segmenting by Location in the European Market for Cars
Car manufacturers like Volkswagen and BMW who do a lot of business in Europe sell the same car in many different countries. The customers in these countries have very different incomes and tastes in cars. Because the automakers in this market likely have some market power, this is an excellent opportunity for segmenting if the automakers can prevent their customers in one country from selling to those in another. Manufacturers could then segment their customers by country, selling the same car at different prices in each country using the price-

It turns out the auto companies have many options for preventing resale across countries. First, they can print all manuals and documents only in the country’s language. Swedish drivers don’t want manuals in Greek, and vice versa. Second, they can forbid servicing a car in a country other than the one in which it was purchased. No one wants to get towed to Romania when their car experiences problems in Spain. Third, they can punish dealers who sell cars to people from a different country.
Economists Pinelopi Goldberg and Frank Verboven gathered evidence on car prices in Europe to investigate this issue.5 They found that the price of the same car could vary substantially across countries. In 2015 the price of a base model VW Golf in Germany was almost 20% more expensive than in Greece, but about 20% lower than in Portugal.
Goldberg and Verboven concluded that some of the price differences across countries in Europe arose from differences in the taxation of autos, but that much of the price difference was due to basic direct price discrimination by segmenting. The auto firms were varying their markups depending on the conditions of local demand. The VW Golf pricing patterns are consistent with the theory that demand in Germany is less elastic than in Greece but more elastic than in Portugal, so VW charges its German customers more than its Greek customers, and the Portuguese pay still more. 
Over Time One way to price-
395
In other cases, demand can become less price-
In either situation, a firm that prices the same good differently in two different time periods applies the basic segmentation rules and uses the standard monopoly pricing rule as it applies to the state of demand in each period.
However, there is one complication in pricing across time that is worth keeping in mind. Technically, pricing across time is only segmenting if the seller directly assigns customers to a given time period. That is, in segmentation strategies, the seller is effectively saying, “You buyers over here, this is your price. You buyers over there, you have a different price.” Buyers are stuck paying the price designated for their group (assuming again as we have throughout this chapter that the seller can prevent resale). With time-
For instance, Intel might want to initially price its fast new CPU at an extremely high level to take advantage of a segment of high-
The more forward-