3.5 Subsidies
subsidy
A payment by the government to a buyer or seller of a good or service.
A subsidy is a payment by the government to a buyer or seller of a good or service. It is, in essence, the exact opposite of a tax. In fact, when we analyze the effects of subsidies on markets, we can treat the subsidy as a negative tax. Thus, the price the buyer pays is lower than the price the supplier receives after the subsidy. If the government subsidizes gasoline by $1 per gallon, for example, then buyers might pay $3.50 per gallon at the pump, but gas stations receive $4.50 per gallon because they get to add the government dollar to the $3.50. This relationship is Pb + subsidy = Ps, where Pb is the price the buyer pays (the market price) and Ps is the price the seller receives after the subsidy is paid.
96
Governments tax a lot, but they also subsidize the production of many different goods and services. Let’s look at the effects of the U.S. government subsidy for the domestic production of ethanol, a corn-
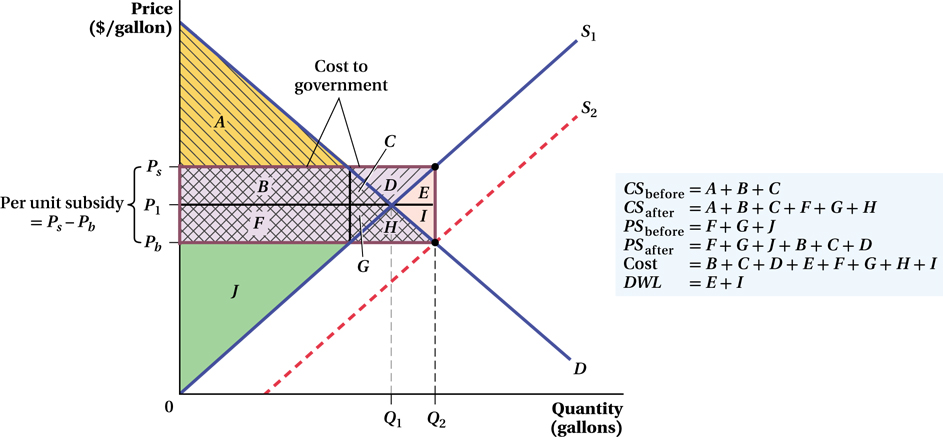
Before the subsidy was in place, consumer surplus was everything below the demand curve and above the price that consumers pay (P1), area A + B + C in Figure 3.15. After the subsidy, consumer surplus will change. But it will not get smaller, as in the case of a tax. It will get larger. The new consumer surplus is the area below the demand curve and above the price that the consumers have to pay (the new lower price, Pb ). This is the old consumer surplus A + B + C plus the new part F + G + H. This additional surplus comes from the lower price and the additional sales at that price.
Before the subsidy, the producer surplus was everything above the supply curve but below the price the suppliers received (P1 ), area F + G + J. After the subsidy, producer surplus gets bigger, too. The area above the producers’ own supply curve S1 and below the price that the suppliers receive (Ps ) is now F + G + J plus B + C + D. [We calculate producer surplus using the producers’ supply curve (S1) because this is the supply curve that embodies the suppliers’ costs of production.]
97
Note that parts of the consumer and producer surplus areas overlap in this case (areas B + C + F + G ) because both sides are getting more surplus than before. The only way this is possible, however, is if someone else foots the bill. In this case, it’s the government. The subsidy costs money. The cost of the subsidy is the subsidy amount times the quantity produced, Q2 × (Ps – Pb), which amounts to the rectangle B + C + D + E + F + G + H + I.
This isn’t the only cost of the subsidy, however. Like any other price regulation, a subsidy also creates deadweight loss. It might seem odd at first that there would be DWL when both consumers and producers are better off after the subsidy. The key is to compare how much their surplus goes up to how much the subsidy costs the government. While consumer surplus went up by F + G + H and producer surplus by B + C + D, total government outlays for the subsidy were (F + G + H ) + (B + C + D ) + (E + I ). Therefore, the subsidy’s DWL is E + I. Society as a whole pays more for the subsidy than the added benefit it gave to consumers and producers. If somehow the government could just turn over the subsidy revenue to consumers and producers without changing the price, society would be better off. By changing the price, it gets some extra people to buy gasoline (with ethanol added) who really were not interested in buying before.
When we looked at the market interventions earlier in this chapter, the DWL derived from the surplus lost by people who would have bought if there were no tax or regulation, but do not buy when the tax is in place and the price is too high. Here, it is the other way around. The DWL comes from people who would not have made a purchase in a competitive market. They only make a purchase because the subsidy lowers the price. The amount they value the extra quantity is less than it costs the government to move them to buy it.
A different way to understand this deadweight loss is to think about people giving presents to each other. Economist Joel Waldfogel asked microeconomics students who received Christmas presents how much they thought the gifts they received cost the people who bought them.12 Then he asked the students how much the gifts were worth to them, apart from the sentimental value. The students valued the presents they got by about 15% less than the presents’ cost to purchase. This 15% DWL from Christmas presents is just like the DWL from a subsidy. When the government subsidizes a product, it gives consumers a gift: The consumers value the gift (as measured by the consumer surplus) less than it costs the government to buy it (as measured by the revenue cost).
Application: The Cost of the Black-Liquor Loophole
An example of a subsidy gone awry is the so-
It turns out that there is a chemical by-
98
How does our analysis in this section explain what happened? The tax credit became, in practice, a diesel subsidy for the paper industry. By tying the credit to the use of blended fuels, it lowered the effective price of diesel that the paper companies faced. Before, when they had to pay the market price, their quantity demanded for diesel to fuel their plants was zero—
As a result of this policy, the paper companies and the diesel sellers are better off because of the subsidy. But the costs are large. First, there is deadweight loss: An industry that wasn’t using diesel before because it had a superior alternative now demands it, even though the industry values it at less than the cost of supplying it. Second, the government has to pay the subsidy. And as noted above, that’s a really big number. Congress tried to close the loophole in 2010 because they decided that the country couldn’t afford it, though legal issues have allowed the paper companies to continue receiving tax breaks since the repeal. 
figure it out 3.4
Suppose the demand for and supply of ethanol in a small town are as follows:
QD = 9,000 – 1,000P
QS = 2,000P – 3,000
where Q measures gallons per day and P represents price per gallon. The current equilibrium price is $4, and the current equilibrium quantity is 5,000 gallons per day.
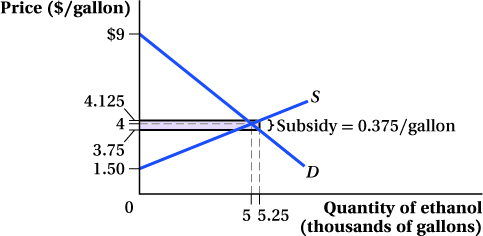
Now suppose that the government wants to create a subsidy of $0.375 per gallon to encourage the use of ethanol.
What will happen to the price buyers pay per gallon, the price sellers receive per gallon, and the number of gallons consumed each day?
How much will this subsidy cost the government (and ultimately taxpayers)?
Solution:
Determining the prices that buyers and sellers face under a subsidy is done in a way similar to how we determined the prices for buyers and sellers in the presence of a tax. However, there is one big difference. Now, the price sellers receive is actually larger than the price paid by buyers (due to the subsidy):
Ps = Pb + subsidy
So now we know that in our problem
Ps = Pb + 0.375
99
Remember that we need to start with the demand and supply equations in the following form:
QD = 9,000 – 1,000Pb
QS = 2,000Ps – 3,000
Once we have these, we can substitute for Ps in the supply equation so that it becomes
QS = 2,000Ps – 3,000
QS = 2,000(Pb + 0.375) – 3,000 = 2,000Pb + 750 – 3,000 = 2,000Pb – 2,250
Now, we can equate QD and QS to solve for Pb:
9,000 – 1,000Pb = 2,000Pb – 2,250
3,000Pb = 11,250
Pb = 3.75
Ps = Pb + 0.375
Ps = 4.125
To solve for the quantity of ethanol sold after the subsidy is put in place, we can substitute Pb into the demand equation or substitute Ps into the supply equation. (It is a good idea to do both to check your work.)
QD = 9,000 – 1,000Pb = 9,000 – 1,000(3.75) = 9,000 – 3,750 = 5,250
QS = 2,000Ps – 3,000 = 2,000(4.125) – 3,000 = 8,250 – 3,000 = 5,250
So, buyers will pay $3.75 per gallon, sellers will receive $4.125 per gallon, and 5,250 gallons will be sold each day. This can be seen in the figure below.
The cost of the subsidy will be the subsidy per gallon multiplied by the number of gallons sold:
Cost of subsidy = ($0.375)(5,250) = $1,968.75 per day