Taking Measure: Power Capability of the Leading States, 1816–1830
Printed Page 670
Important EventsThe figures on the graph measure the relative ability of states to fight wars based on their military capacity (personnel and expenditures), energy consumption, and iron and steel production. Although necessarily approximate because most states did not keep detailed records of these factors in the early 1800s, the comparison is striking; Great Britain, for example, has a relatively large share (never less than 26.5 percent) even though it had a small army because it had higher levels of energy consumption and iron and steel production and greater financial capabilities.
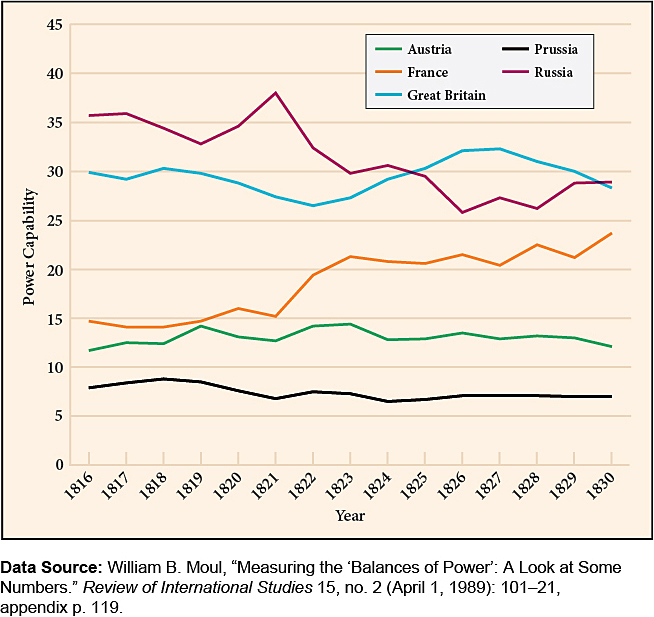
Source: William B. Moul, “Measuring the ‘Balances of Power’: A Look at Some Numbers.” Review of International Studies 15, no. 2 (April 1, 1989): 101–21, appendix p. 119.
Questions to Consider
- Look at the trend over time for each country. Which countries are increasing their capacity to fight wars, which ones are declining in capacity, and which countries stay the same? What are the consequences for the European balance of power?
- France reached a low point at the end of the Napoleonic Wars but then improved its position over the next 15 years. Can you name some specific consequences of this change in status?
- Why is Great Britain, a much smaller country in terms of territory and population, the equal of Russia in terms of the measures given on this table?