PROBLEMS
WORKING WITH THE FIGURES
Question 1
In Figure 5-2, in which of the four processes shown can a complete bacterial genome be transferred from one cell to another?
Question 2
In Figure 5-3, if the concentration of bacterial cells in the original suspension is 200/ml and 0.2 ml is plated onto each of 100 petri dishes, what is the expected average number of colonies per plate?
Question 3
In Figure 5-5,
Why do A− and B− cells, by themselves, not form colonies on the plating medium?
What genetic event do the purple colonies in the middle plate represent?
Question 4
In Figure 5-10c, what do the yellow dots represent?
Question 5
In Figure 5-11, which donor alleles become part of the recombinant genome produced?
Question 6
In Figure 5-12,
Which Hfr gene enters the recipient last? (Which diagram shows it actually entering?)
What is the maximum percentage of cases of transfer of this gene?
Which genes have entered at 25 minutes? Could they all become part of a stable exconjugant genome?
Question 7
In Figure 5-14, which is the last gene to be transferred into the F-
Question 8
In Figure 5-15, how are each of the following genotypes produced?
F+ a−
F− a−
F− a+
F+ a+
Question 9
In Figure 5-17, how many crossovers are required to produce a completely prototrophic exconjugant?
Question 10
In Figure 5-18c, why is the crossover shown occurring in the orange segments of DNA?
Question 11
In Figure 5-19, how many different bacterial species are shown as having contributed DNA to the plasmid pk214?
Question 12
In Figure 5-25, can you point to any phage progeny that could transduce?
Question 13
In Figure 5-28, what are the physical features of the plaques of recombinant phages?
Question 14
In Figure 5-29, do you think that b+ could be transduced instead of a+? As well as a+?
Question 15
In Figure 5-30, which genes show the highest frequencies of cotransduction?
Question 16
In Figure 5-32, what do the half-
Question 17
In Figure 5-33, which is the rarest λ genotype produced in the initial lysate?
Question 18
In Figure 5-38, precisely which gene is eventually identified from the genome sequence?
BASIC PROBLEMS
Question 19
Describe the state of the F factor in an Hfr, F+, and F− strain.
Question 20
How does a culture of F+ cells transfer markers from the host chromosome to a recipient?
Question 21
With respect to gene transfer and the integration of the transferred gene into the recipient genome, compare
Hfr crosses by conjugation and generalized transduction.
F′ derivatives such as F′ lac and specialized transduction.
Question 22
Why is generalized transduction able to transfer any gene, but specialized transduction is restricted to only a small set?
Question 23
A microbial geneticist isolates a new mutation in E. coli and wishes to map its chromosomal location. She uses interrupted-
Question 24
In E. coli, four Hfr strains donate the following markers, shown in the order donated:
|
Strain 1: |
M |
Z |
X |
W |
C |
|
Strain 2: |
L |
A |
N |
C |
W |
|
Strain 3: |
A |
L |
B |
R |
U |
|
Strain 4: |
Z |
M |
U |
R |
B |
All these Hfr strains are derived from the same F+ strain. What is the order of these markers on the circular chromosome of the original F+?
Question 25
You are given two strains of E. coli. The Hfr strain is arg+ ala+ glu+ pro+ leu+ Ts; the F− strain is arg− ala− glu− pro− leu− Tr. All the markers are nutritional except T, which determines sensitivity or resistance to phage T1. The order of entry is as given, with arg+ entering the recipient first and Ts last. You find that the F− strain dies when exposed to penicillin (pens), but the Hfr strain does not (penr). How would you locate the locus for pen on the bacterial chromosome with respect to arg, ala, glu, pro, and leu? Formulate your answer in logical, well-
 Unpacking the Problem
Question 26
A cross is made between two E. coli strains: Hfr arg+ bio+ leu+ × F− arg− bio− leu−. Interrupted mating studies show that arg+ enters the recipient last, and so arg+ recombinants are selected on a medium containing bio and leu only. These recombinants are tested for the presence of bio+ and leu+. The following numbers of individuals are found for each genotype:
|
arg+ bio+ leu+ |
320 |
|
arg+ bio+ leu− |
8 |
|
arg+ bio− leu+ |
0 |
|
arg+ bio− leu− |
48 |
What is the gene order?
What are the map distances in recombination percentages?
Question 27
Linkage maps in an Hfr bacterial strain are calculated in units of minutes (the number of minutes between genes indicates the length of time that it takes for the second gene to follow the first in conjugation). In making such maps, microbial geneticists assume that the bacterial chromosome is transferred from Hfr to F− at a constant rate. Thus, two genes separated by 10 minutes near the origin end are assumed to be the same physical distance apart as two genes separated by 10 minutes near the F− attachment end. Suggest a critical experiment to test the validity of this assumption.
Question 28
A particular Hfr strain normally transmits the pro+ marker as the last one in conjugation. In a cross of this strain with an F− strain, some pro+ recombinants are recovered early in the mating process. When these pro+ cells are mixed with F− cells, the majority of the F− cells are converted into pro+ cells that also carry the F factor. Explain these results.
Question 29
F′ strains in E. coli are derived from Hfr strains. In some cases, these F′ strains show a high rate of integration back into the bacterial chromosome of a second strain. Furthermore, the site of integration is often the site occupied by the sex factor in the original Hfr strain (before production of the F′ strains). Explain these results.
Question 30
You have two E. coli strains, F− strs ala− and Hfr strs ala+, in which the F factor is inserted close to ala+. Devise a screening test to detect strains carrying F′ ala+.
Question 31
Five Hfr strains A through E are derived from a single F + strain of E. coli. The following chart shows the entry times of the first five markers into an F− strain when each is used in an interrupted-
|
A |
B |
C |
D |
E |
|||||
|---|---|---|---|---|---|---|---|---|---|
|
mal+ |
(1) |
ade+ |
(13) |
pro+ |
(3) |
pro+ |
(10) |
his+ |
(7) |
|
strs |
(11) |
his+ |
(28) |
met+ |
(29) |
gal+ |
(16) |
gal+ |
(17) |
|
ser+ |
(16) |
gal+ |
(38) |
xyl+ |
(32) |
his+ |
(26) |
pro+ |
(23) |
|
ade+ |
(36) |
pro+ |
(44) |
mal+ |
(37) |
ade+ |
(41) |
met+ |
(49) |
|
his+ |
(51) |
met+ |
(70) |
strs |
(47) |
ser+ |
(61) |
xyl+ |
(52) |
Draw a map of the F+ strain, indicating the positions of all genes and their distances apart in minutes.
Show the insertion point and orientation of the F plasmid in each Hfr strain.
In the use of each of these Hfr strains, state which allele you would select to obtain the highest proportion of Hfr exconjugants.
Question 32
Streptococcus pneumoniae cells of genotype strs mtl− are transformed by donor DNA of genotype strr mtl+ and (in a separate experiment) by a mixture of two DNAs with genotypes strr mtl− and strs mtl+. The accompanying table shows the results.
|
|
Percentage of cells transformed into |
||
|---|---|---|---|
|
Transforming DNA |
strr mtl− |
strs mtl+ |
strr mtl+ |
|
strr mtl+ |
4.3 |
0.40 |
0.17 |
|
strr mtl− + strs mtl+ |
2.8 |
0.85 |
0.0066 |
What does the first row of the table tell you? Why?
What does the second row of the table tell you? Why?
Question 33
Recall that, in Chapter 4, we considered the possibility that a crossover event may affect the likelihood of another crossover. In the bacteriophage T4, gene a is 1.0 m.u. from gene b, which is 0.2 m.u. from gene c. The gene order is a, b, c. In a recombination experiment, you recover five double crossovers between a and c from 100,000 progeny viruses. Is it correct to conclude that interference is negative? Explain your answer.
Question 34
E. coli cells were infected with two strains of T4 virus. One strain is minute (m), rapid lysis (r), and turbid (t); the other is wild type for all three markers. The lytic products of this infection were plated and classified. The resulting 10,342 plaques were distributed among eight genotypes as follows:
|
m r t |
3469 |
m + + |
521 |
|
+ + + |
3727 |
+ r t |
475 |
|
m r + |
854 |
+ r + |
171 |
|
m + t |
163 |
+ + t |
963 |
What are the linkage distances between m and r, between r and t, and between m and t.
Determine the linkage order for the three genes.
What is the coefficient of coincidence (see Chapter 4) in this cross? What does it signify?
Question 35
With the use of P22 as a generalized transducing phage grown on a pur+ pro+ his+ bacterial donor, a recipient strain of genotype pur− pro− his− was infected and incubated. Afterward, transductants for pur+, pro+, and his+ were selected individually in experiments I, II, and III, respectively.
What medium is used in each of these selection experiments?
The transductants were examined for the presence of unselected donor markers, with the following results:
I
II
III
pro− his− 86%
pur− his− 44%
pur− pro− 20%
pro+ his− 0%
pur+ his− 0%
pur+ pro− 14%
pro− his+ 10%
pur− his+ 54%
pur− pro+ 61%
pro+ his+ 4%
pur+ his+ 2%
pur+ pro+ 5%
What is the order of the bacterial genes?
Which two genes are closest together?
Based on your answer to part c, explain the relative proportions of genotypes observed in experiment II.
Question 36
Although most λ-mediated gal+ transductants are inducible lysogens, a small percentage of these transductants in fact are not lysogens (that is, they contain no integrated λ). Control experiments show that these transductants are not produced by mutation. What is the likely origin of these types?
Question 37
An ade+ arg+ cys+ his+ leu+ pro+ bacterial strain is known to be lysogenic for a newly discovered phage, but the site of the prophage is not known. The bacterial map is
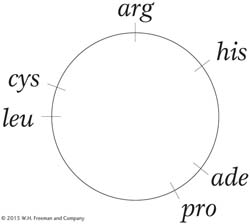
The lysogenic strain is used as a source of the phage, and the phages are added to a bacterial strain of genotype ade − arg − cys − his− leu− pro−. After a short incubation, samples of these bacteria are plated on six different media, with the supplementations indicated in the following table. The table also shows whether colonies were observed on the various media.
|
|
Nutrient supplementation in medium |
|
|||||
|---|---|---|---|---|---|---|---|
|
Medium |
Ade |
Arg |
Cys |
His |
Leu |
Pro |
Presence of colonies |
|
1 |
– |
+ |
+ |
+ |
+ |
+ |
N |
|
2 |
+ |
– |
+ |
+ |
+ |
+ |
N |
|
3 |
+ |
+ |
– |
+ |
+ |
+ |
C |
|
4 |
+ |
+ |
+ |
– |
+ |
+ |
N |
|
5 |
+ |
+ |
+ |
+ |
– |
+ |
C |
|
6 |
+ |
+ |
+ |
+ |
+ |
– |
N |
(In this table, a plus sign indicates the presence of a nutrient supplement, a minus sign indicates that a supplement is not present, N indicates no colonies, and C indicates colonies present.)
What genetic process is at work here?
What is the approximate locus of the prophage?
Question 38
In a generalized-
|
Genotype |
Number of colonies |
|---|---|
|
nad+ pdx+ |
3 |
|
nad+ pdx− |
10 |
|
nad− pdx+ |
24 |
|
nad− pdx− |
13 |
|
|
50 |
What is the cotransduction frequency for pur and nad?
What is the cotransduction frequency for pur and pdx?
Which of the unselected loci is closest to pur?
Are nad and pdx on the same side or on opposite sides of pur? Explain.
(Draw the exchanges needed to produce the various transformant classes under either order to see which requires the minimum number to produce the results obtained.)
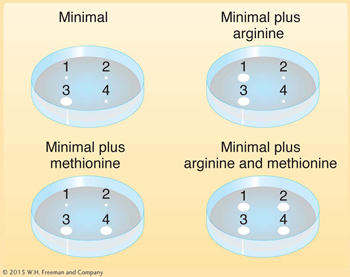
Question 39
In a generalized-
What are the possible genotypes of these colonies?
These colonies are then replica plated onto three different media: (1) minimal plus threonine only, (2) minimal plus leucine only, and (3) minimal. What genotypes could, in theory, grow on these three media?
Of the original colonies, 56 percent are observed to grow on medium 1, 5 percent on medium 2, and no colonies on medium 3. What are the actual genotypes of the colonies on media 1, 2, and 3?
Draw a map showing the order of the three genes and which of the two outer genes is closer to the middle gene.
Question 40
Deduce the genotypes of the following E. coli strains 1 through 4:
Question 41
In an interrupted-
Deduce the genotypes of the two types of cultures.
Draw the crossover events required to produce these genotypes.
Calculate the distance between the pro and thi genes in recombination units.
Unpacking Problem 41
What type of organism is E. coli?
What does a culture of E. coli look like?
On what sort of substrates does E. coli generally grow in its natural habitat?
What are the minimal requirements for E. coli cells to divide?
Define the terms prototroph and auxotroph.
Which cultures in this experiment are prototrophic, and which are auxotrophic?
Given some strains of unknown genotype regarding thiamine and proline, how would you test their genotypes? Give precise experimental details, including equipment.
What kinds of chemicals are proline and thiamine? Does it matter in this experiment?
Draw a diagram showing the full set of manipulations performed in the experiment.
Why do you think the experiment was done?
How was it established that pro enters after thi? Give precise experimental steps.
In what way does an interrupted-
mating experiment differ from the experiment described in this problem? What is an exconjugant? How do you think that exconjugants were obtained? (It might include genes not described in this problem.)
When the pro gene is said to enter after thi, does it mean the pro allele, the pro+ allele, either, or both?
What is “fully supplemented medium” in the context of this question?
Some exconjugants did not grow on minimal medium. On what medium would they grow?
State the types of crossovers that take part in Hfr × F− recombination. How do these crossovers differ from crossovers in eukaryotes?
What is a recombination unit in the context of the present analysis? How does it differ from the map units used in eukaryote genetics?
Question 42
A generalized transduction e xperiment uses a metE+ pyrD+ strain as donor and metE− pyrD− as recipient. metE+ transductants are selected and then tested for the pyrD+ allele. The following numbers were obtained:
|
metE+ pyrD− |
857 |
|
metE+ pyrD+ |
1 |
Do these results suggest that these loci are closely linked? What other explanations are there for the lone “double”?
Question 43
An argC− strain was infected with transducing phage, and the lysate was used to transduce metF− recipients on medium containing arginine but no methionine. The metF+ transductants were then tested for arginine requirement: most were argC+ but a small percentage were found to be argC−. Draw diagrams to show the likely origin of the argC+ and argC− strains.
CHALLENGING PROBLEMS
Question 44
Four E. coli strains of genotype a+ b− are labeled 1, 2, 3, and 4. Four strains of genotype a− b+ are labeled 5, 6, 7, and 8. The two genotypes are mixed in all possible combinations and (after incubation) are plated to determine the frequency of a+ b+ recombinants. The following results are obtained, where M = many recombinants, L = low numbers of recombinants, and 0 = no recombinants:
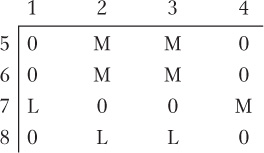
On the basis of these results, assign a sex type (either Hfr, F+, or F−) to each strain.
Question 45
An Hfr strain of genotype a+ b+ c+ d− strs is mated with a female strain of genotype a− b− c− d+ strr. At various times, mating pairs are separated by vigorously shaking the culture. The cells are then plated on three types of agar, as shown below, where nutrient A allows the growth of a− cells; nutrient B, of b− cells; nutrient C, of c− cells; and nutrient D, of d− cells. (A plus indicates the presence of streptomycin or a nutrient, and a minus indicates its absence.)
|
Agar type |
Str |
A |
B |
C |
D |
|---|---|---|---|---|---|
|
1 |
+ |
+ |
+ |
– |
+ |
|
2 |
+ |
– |
+ |
+ |
+ |
|
3 |
+ |
+ |
– |
+ |
+ |
What donor genes are being selected on each type of agar?
The following table shows the number of colonies on each type of agar for samples taken at various times after the strains are mixed. Use this information to determine the order of genes a, b, and c.
Time of sampling
Number of colonies on agar of type
(minutes)
1
2
3
0
0
0
0
5
0
0
0
7.5
102
0
0
10
202
0
0
12.5
301
0
74
15
400
0
151
17.5
404
49
225
20
401
101
253
25
398
103
252
From each of the 25-
minute plates, 100 colonies are picked and transferred to a petri dish containing agar with all the nutrients except D. The numbers of colonies that grow on this medium are 90 for the sample from agar type 1, 52 for the sample from agar type 2, and 9 for the sample from agar type 3. Using these data, fit gene d into the sequence of a, b, and c. At what sampling time would you expect colonies to first appear on agar containing C and streptomycin but no A or B?
Question 46
In the cross Hfr aro+ arg+ eryr strs × F− aro− arg− erys strr, the markers are transferred in the order given (with aro+ entering first), but the first three genes are very close together. Exconjugants are plated on a medium containing Str (streptomycin, to kill Hfr cells), Ery (erythromycin), Arg (arginine), and Aro (aromatic amino acids). The following results are obtained for 300 colonies isolated from these plates and tested for growth on various media: on Ery only, 263 strains grow; on Ery + Arg, 264 strains grow; on Ery + Aro, 290 strains grow; on Ery + Arg + Aro, 300 strains grow.
Draw up a list of genotypes, and indicate the number of individuals in each genotype.
Calculate the recombination frequencies.
Calculate the ratio of the size of the arg-to-aro region to the size of the ery-to-arg region.
Question 47
A bacterial transformation is performed with a donor strain that is resistant to four drugs, A, B, C, and D, and a recipient strain that is sensitive to all four drugs. The resulting recipient cell population is divided and plated on media containing various combinations of the drugs. The following table shows the results.
|
Drugs added |
Number of colonies |
Drugs added |
Number of colonies |
|---|---|---|---|
|
None |
10,000 |
BC |
50 |
|
A |
1155 |
BD |
48 |
|
B |
1147 |
CD |
785 |
|
C |
1162 |
ABC |
31 |
|
D |
1140 |
ABD |
43 |
|
AB |
47 |
ACD |
631 |
|
AC |
641 |
BCD |
35 |
|
AD |
941 |
ABCD |
29 |
One of the genes is distant from the other three, which appear to be closely linked. Which is the distant gene?
What is the likely order of the three closely linked genes?
Question 48
You have two strains of λ that can lysogenize E. coli; their linkage maps are as follows:
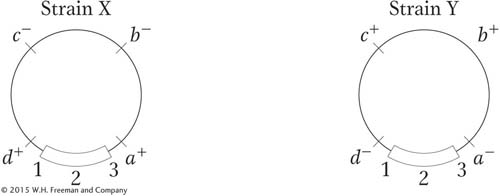
The segment shown at the bottom of the chromosome, designated 1–
Diagram the way in which λ strain X is inserted into the E. coli chromosome (so that the E. coli is lysogenized).
The bacteria that are lysogenic for strain X can be superinfected by using strain Y. A certain percentage of these superinfected bacteria become “doubly” lysogenic (that is, lysogenic for both strains). Diagram how it will take place. (Don’t worry about how double lysogens are detected.)
Diagram how the two λ prophages can pair
Crossover products between the two prophages can be recovered. Diagram a crossover event and the consequences.
Question 49
You have three strains of E. coli. Strain A is F′ cys+ trp1/cys+ trp1 (that is, both the F′ and the chromosome carry cys+ and trp1, an allele for tryptophan requirement). Strain B is F−cys− trp2 Z (this strain requires cysteine for growth and carries trp2, another allele causing a tryptophan requirement; strain B is lysogenic for the generalized transducing phage Z). Strain C is F− cys+ trp1 (it is an F− derivative of strain A that has lost the F′). How would you determine whether trp1 and trp2 are alleles of the same locus? (Describe the crosses and the results expected.)
Question 50
A generalized transducing phage is used to transduce an a− b− c− d− e− recipient strain of E. coli with an a+ b+ c+ d+ e+ donor. The recipient culture is plated on various media with the results shown in the following table. (Note that a− indicates a requirement for A as a nutrient, and so forth.) What can you conclude about the linkage and order of the genes?
|
Compounds added to minimal medium |
Presence (+) or absence (–) of colonies |
|---|---|
|
CDE |
– |
|
BDE |
– |
|
BCE |
+ |
|
BCD |
+ |
|
ADE |
– |
|
ACE |
– |
|
ACD |
– |
|
ABE |
– |
|
ABD |
+ |
|
ABC |
– |
Question 51
In 1965, Jon Beckwith and Ethan Signer devised a method of obtaining specialized transducing phages carrying the lac region. They knew that the integration site, designated att80, for the temperate phage ϕ80 (a relative of phage λ) was located near tonB, a gene that confers resistance to the virulent phage T1:

They used an F′ lac+ plasmid that could not replicate at high temperatures in a strain carrying a deletion of the lac genes. By forcing the cell to remain lac+ at high temperatures, the researchers could select strains in which the plasmid had integrated into the chromosome, thereby allowing the F′ lac to be maintained at high temperatures. By combining this selection with a simultaneous selection for resistance to T1 phage infection, they found that the only survivors were cells in which the F′ lac had integrated into the tonB locus, as shown here:
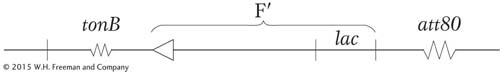
This result placed the lac region near the integration site for phage ϕ80. Describe the subsequent steps that the researchers must have followed to isolate the specialized transducing particles of phage ϕ80 that carried the lac region.
Question 52
Wild-