20.4 Cumulative Selection and Multistep Paths to Functional Change
Because so much sequence evolution is neutral, there is no simple relation between the amount of change in a gene’s DNA and the amount of change, if any, in the encoded protein’s function. At one extreme, almost the entire amino acid sequence of a protein can be replaced while maintaining the original function if those amino acids that are substituted maintain the enzyme’s three-
In contrast, the function of an enzyme can be changed by a single amino acid substitution. The sheep blowfly, Lucilia cuprina, has evolved resistance to organophosphate insecticides used widely to control it. Richard Newcombe, Peter Campbell, and their colleagues showed that this resistance is the consequence of a single substitution of an aspartic acid for a glycine residue in the active site of an enzyme that is ordinarily a carboxylesterase (splits a carboxyl ester, R–
KEY CONCEPT
There is no proportionate relation between how much DNA change takes place in evolution and how much change in function results.Selection clearly plays a role in the evolution of insect carboxylesterase and insecticide resistance. In many cases, however, the amino acid replacements that alter the function of the protein are more numerous and accumulate through repeated rounds of mutation and selection, what is referred to as cumulative selection. The power of cumulative selection to drive greater changes in a molecule’s function is one of the least appreciated facets of evolution by natural selection. One reason is that the role of selection in each of the multiple replacements is more difficult to ascertain.
KEY CONCEPT
Cumulative selection can drive the fixation of many changes in evolving molecules.In order to understand the role of selection in cases of multiple substitutions, two major approaches are taken: empirical experimental analysis and statistical methods. We will illustrate the former first.
Multistep pathways in evolution
When mutations arise at multiple sites in the evolution from one phenotypic state to another, there are multiple possible orders in which these mutations can appear, each representing a different pathway through the genetic space that evolution might take. Such multistep pathways of evolutionary change are referred to as adaptive walks.
Suppose that the difference between the original phenotype and the evolved form is a consequence of mutations at five sites, A, B, C, D, and E. There are many different orders in which these mutations could have occurred over evolutionary time. First, site A may have been fixed in the population, then D, then C, then E, and, finally, B. On the other hand, the order of fixation might have been E, D, A, B, C. For five sites there are 5 × 4 × 3 × 2 × 1 = 120 possible orders. Two important questions in understanding evolution are: How many of these alternative evolutionary pathways are possible? And, what are the probabilities of the different possible pathways relative to one another?
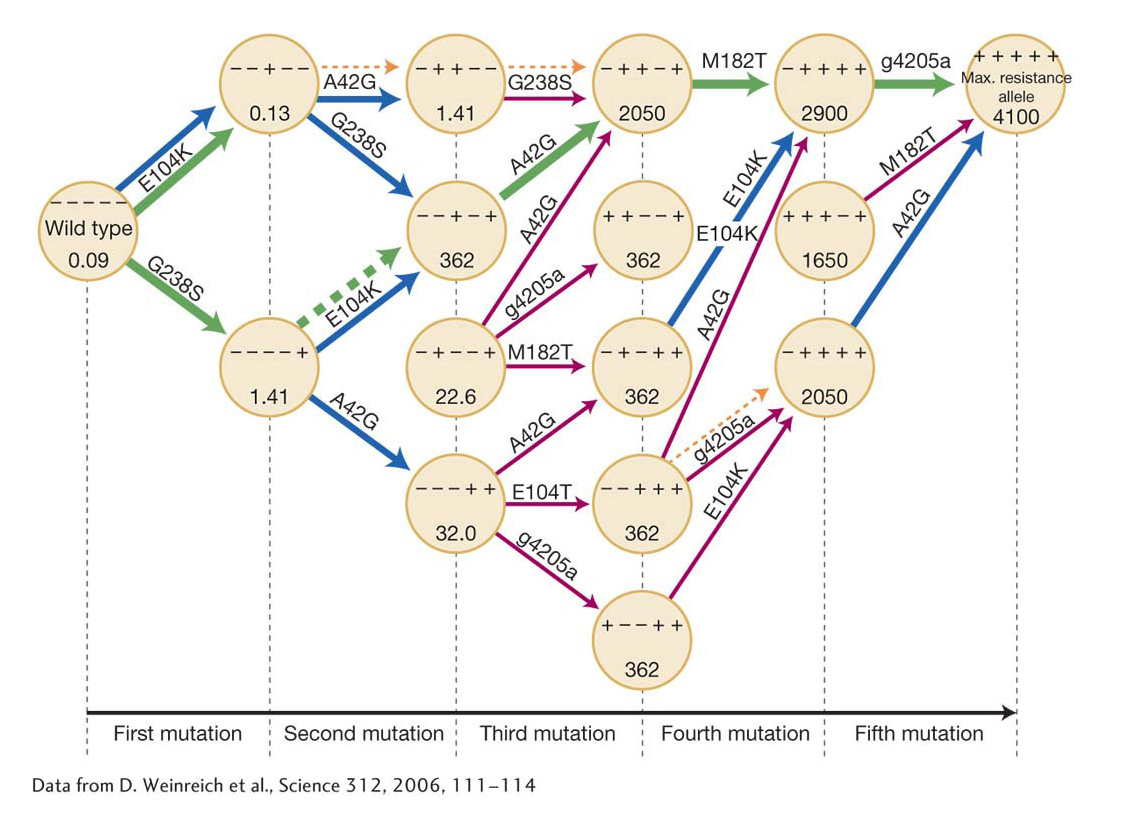
Daniel Weinreich and his colleagues have characterized in detail such a set of adaptive walks through genetic space in their study of the evolution of antibiotic resistance in the bacterium E. coli. Resistance to the antibiotic cefotaxime is acquired through the accumulation of five mutations at different sites in the bacterial ß-lactamase gene. Four of the mutations lead to amino acid changes, and the fifth is a noncoding mutation. When all five mutations are present, the minimum concentration of antibiotic required to inhibit bacterial growth increases by a factor of 100,000. The experimenters first measured the resistance conferred by a mutation at a given site in the presence of all 24 = 16 possible combinations of mutants and nonmutants at the other four sites. In most combinations, but not all, a mutant at one site was more resistant, irrespective of the state of the other four sites. For example, a mutant at site G238S showed significant resistance, irrespective of the mutant or nonmutant state of the other four sites (Table 20-3). On the other hand, the mutation at the noncoding site g4205a conferred significant resistance in eight combinations, negligible change in resistance in six cases, and a decrease in resistance in two combinations. This dependency of the fitness advantage or disadvantage of a new mutation on the mutations that have previously been fixed is what the experimenters call sign epistasis.
|
Mutation* |
Number of alleles on which mean mutational effect is |
Mean proportional increase |
||
|---|---|---|---|---|
|
|
Positive |
Negative |
Negligible |
|
|
g4205a |
8 |
2 |
6 |
1.4 |
|
A42G |
12 |
0 |
4 |
5.9 |
|
E104K |
15 |
1 |
0 |
9.7 |
|
M182T |
8 |
3 |
5 |
2.8 |
|
G238S |
16 |
0 |
0 |
1.0 × 10³ |
|
*The mutations leading to antibiotic resistance are designated by their nucleotide or amino acid position. Of the 16 possible allelic combinations of the four other sites, the positive, negative, or neutral effects of the mutation are indicated along with the mean proportional increase in fitness for mutations at the indicated site. |
||||
Weinreich and colleagues measured the resistance at every stage in the temporal sequence of adding mutations one site after another. If a mutation in one of the 120 possible orderings did not confer a higher resistance, then presumably that evolutionary path would terminate, because there would be no selection either in favor of the mutation or even against it. They found that, of the 120 possible pathways through the mutational history, only 18 provided increased resistance at each mutational step. Thus, 102/120 = 85 percent of the possible mutational pathways to maximum resistance were not accessible to evolution by natural selection. Finally, we assume that, in a population evolving resistance, the likelihood that a particular accessible pathway will actually be followed is proportional to the magnitude of the increased resistance at each step. Under that assumption, only 10 of the 18 accessible pathways will account for 90 percent of the cases of evolution of bacterial resistance to the antibiotic (Figure 20-9).
KEY CONCEPT
The order in which mutations occur is of critical importance in determining the path of evolution and whether evolution by natural selection will or will not actually reach the most advantageous state. Because the order of occurrence of mutations is random, many advantageous phenotypes may never be achieved even though the individual mutations occur.A key factor, then, in determining the evolutionary path a population may follow is the randomness of the mutational process. After the initial genetic variation is exhausted by the selective and random fixation of alleles, new variation arising from mutation can be the source of yet further evolutionary change. The particular direction of this further evolution depends on the particular mutations that occur and the temporal order in which they arise.
A very clear illustration of this historical contingency of adaptive walks is a selection experiment carried out by Holly Wichman and her colleagues. They forced the bacteriophage ϕX174 to reproduce at high temperatures and on the host Salmonella typhimurium instead of its normal host, Escherichia coli. Two independent lines of viruses were established, labeled TX and ID, and kept separate, although both were exposed to the same conditions. Both evolved the ability to reproduce at high temperatures in the new host. In one of the two lines, the ability to reproduce on E. coli still existed, but, in the other line, the ability was lost. The bacteriophage has only 11 genes, and so the experimenters were able to record the successive changes in the DNA for all these genes and in the proteins encoded by them during the selection process. There were 15 DNA changes in strain TX, located in six different genes; in strain ID, there were 14 changes located in four different genes. In seven cases, the changes to the two strains were identical, including a large deletion, but even these identical changes appeared in each line in a different order (Table 20-4). So, for example, the change at DNA site 1533, causing a substitution of isoleucine for threonine, was the third change in the ID strain but the 14th change in the TX strain.
|
Order* |
TX site |
Amino acid change |
ID site |
Amino acid change |
|---|---|---|---|---|
|
1 |
782 |
E72, T → 1 |
2167 |
F388, H → Q |
|
2 |
1727 |
F242, L → F |
1613 |
F204, T → S |
|
3 |
2085 |
F361, A → V |
15336 |
F177, T → I |
|
4 |
319 |
C63, V → F |
1460 |
F153, Q → E |
|
5 |
2973 |
H15, G → S |
1300 |
F99, silent |
|
6 |
323 |
C64, D → G |
13053 |
F101, G → D |
|
7 |
41103 |
A44, H → Y |
1308 |
F102, Y → C |
|
8 |
1025 |
F8, E → K |
41101 |
A44, H → Y |
|
9 |
31667 |
H79, A → V |
4637 |
A219, silent |
|
10 |
5185 |
A402, T → M |
965- |
deletion |
|
11 |
13052 |
F101, G → D |
53655 |
A462, M → T |
|
12 |
965- |
deletion |
41687 |
A63, Q → R |
|
13 |
53655 |
A462, M → T |
31662 |
H79, A → V |
|
14 |
15331 |
F177, T → I |
1809 |
F269, K → R |
|
15 |
41686 |
A63, Q → R |
||
|
*Changes are listed in the order in which they appeared in each of the two bacteriophage selection lines. The nucleotide position is listed, followed by the protein affected, A– |
||||
|
Source: H. A. Wichman et al., Science 285, 1999, 422– |
||||
Thus, the course of evolution followed by the initially identical viruses depended on the mutations available at any given time in the cumulative selection process. Contrast this situation with the repeated origin of the sickle-
KEY CONCEPT
Under identical conditions of natural selection, two populations may arrive at identical or two different genetic compositions as a direct result of natural selection.The experimental dissection of evolutionary pathways is very time consuming and expensive. In addition, it is often not practical for experimenters to engineer every possible genotype in an adaptive walk in populations or to attempt to measure relative fitness of many organisms in the wild. The antibiotic-
The signature of positive selection on DNA sequences
The demonstration of the molecular clock argues that most nucleotide substitutions that have occurred in evolution were neutral, but it does not tell us how much of molecular evolution has been adaptive change driven by positive selection. One way of detecting the adaptive evolution of a protein is by comparing the synonymous and nonsynonymous nucleotide polymorphisms within species with the synonymous and nonsynonymous nucleotide changes between species. If all mutations are neutral, the ratio of nonsynonymous to synonymous nucleotide polymorphisms within a species should be the same as the ratio of nonsynonymous to synonymous nucleotide substitutions between species. On the other hand, if the amino acid changes between species have been driven by positive selection, there ought to be an excess of nonsynonymous changes between species.
One test for detecting positive selection on DNA sequences was developed by John McDonald and Martin Kreitman. This test involves several logical but simple steps:
The DNA sequence of a gene is obtained from a number of separate individuals or strains from each of the two species. Ten or more sequences from each species would be desirable. The fixed nucleotide differences between species are then classified into nonsynonymous (a) and synonymous (b) differences.
The nucleotide differences among individuals within each species (polymorphisms) are then tabulated, and classified as either those that result in amino acid changes (nonsynonymous polymorphisms; c in the table below) or those that do not change the amino acid (synonymous polymorphisms; d in the accompanying table).
If the divergence between the species is purely the result of random genetic drift, then we expect a/b to be equal to c/d. If, on the other hand, there has been selective divergence, there should be an excess of fixed nonsynonymous differences, and so a/b should be greater than c/d.
|
Fixed species differences |
Polymorphisms |
|
|---|---|---|
|
Nonsynonymous |
a |
c |
|
Synonymous |
b |
d |
|
Ratio |
a/b |
c/d |
Table 20-5 shows an application of this principle to the alcohol dehydrogenase gene in three closely related species of Drosophila. Clearly, there is an excess of amino acid replacements between species over what is expected. Therefore, we conclude that some of the amino acid replacements in the enzyme were adaptive changes driven by natural selection.
|
Organism |
Species differences |
Polymorphisms |
|---|---|---|
|
Nonsynonymous |
7 |
2 |
|
Synonymous |
17 |
42 |
|
Ratio |
0.29:0.71 |
0.05:0.95 |
|
Source: J. McDonald and M. Kreitman, “Adaptive Protein Evolution at the Adh locus in Drosophila,” Nature 351, 1991, 652– |
||