9-2 The Visual System’s Functional Anatomy
Our primary sensory experience is visual. Far more of the human brain is dedicated to vision than to any other sense. Understanding the visual system’s organization, then, is key to understanding human brain function. To build this understanding, we begin by following the routes visual information takes into and within the brain. This exercise is a bit like traveling a road to discover where it goes. As you trace the route, keep in mind the photograph in Focus 9-1 (page 284) and what the different levels of the visual system are doing to capture that image in the brain.
Structure of the Retina
Virtually all retinal neurons are insensitive to light so are unaffected by light passing through them.
Light energy travels from the outside world through the pupil and into the eye, where it strikes a light-
Figure 9-2 includes a photograph of the retina, which is composed of photoreceptors beneath a layer of neurons connected to them. The neurons lie in front of the photoreceptor cells, but they do not prevent incoming light from being absorbed by those receptors, because the neurons are transparent and the photoreceptors are extremely sensitive to light. In addition, special glial cells in the retina called Müller cells span from the retina’s inner membrane at the front to the photoreceptors at the back of the retina and act as optical fibers, channeling light to the buried photoreceptors.
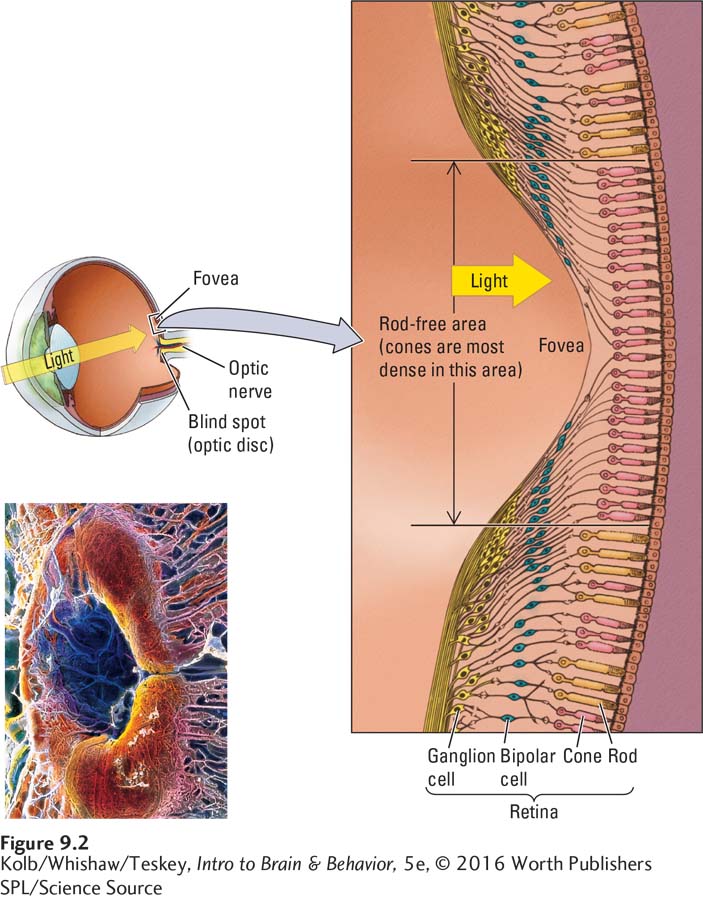
Together, the photoreceptor cells and the retinal neurons perform some amazing functions. They translate light into action potentials, discriminate wavelengths so that we can distinguish colors, and work in a range of light intensities from bright to dim. These cells afford visual precision sufficient for us to see a human hair lying on the page of this book from a distance of 18 inches.
As in a camera, the image of objects projected onto the retina is upside down and backward. This flip-
If for several days you were to wear glasses that invert visual images, the world would first appear upside down but then would suddenly appear right side up again because your brain would correct the distortion (Held, 1968). Curiously, when you removed the glasses, the world would temporarily seem upside down once more, because your brain at first would be unaware that you had tricked it again. Eventually, though, your brain would solve this puzzle too, and the world would flip back to the correct orientation.
Fovea
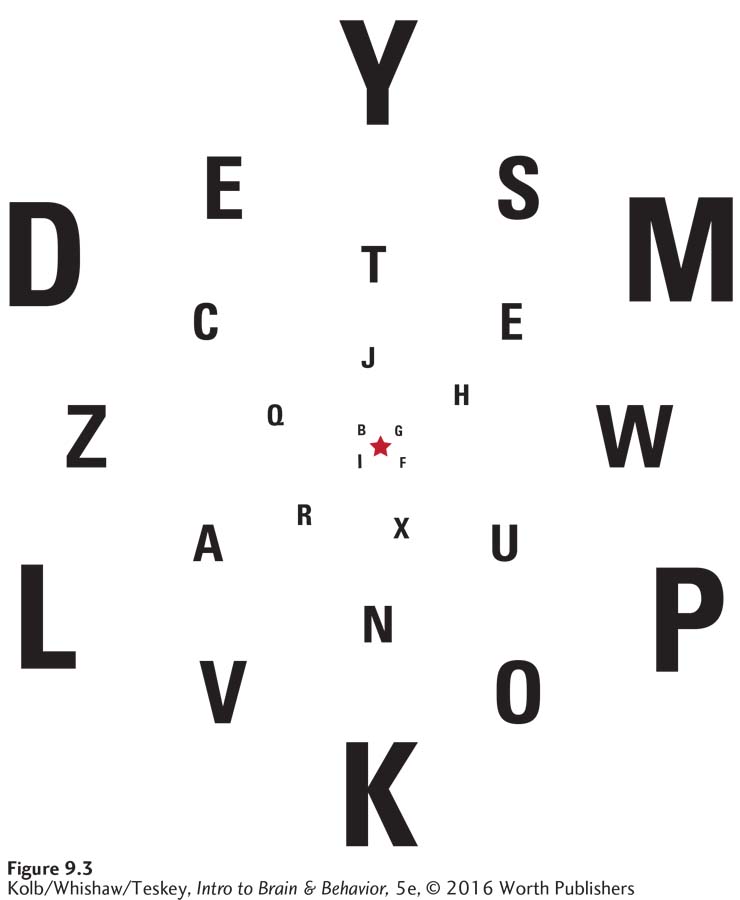
Try this experiment. Focus on the print at the left edge of this page. The words will be clearly legible. Now, while holding your eyes still, try to read the words on the right side of the page. It will be very difficult, even impossible, even though you can see that words are there.
THE BASICS
Visible Light and the Structure of the Eye
The brain’s visual system analyzes visible light—
Light: The Stimulus for Vision
Light can enter the eye directly from a source that produces it—
Structure of the Eye
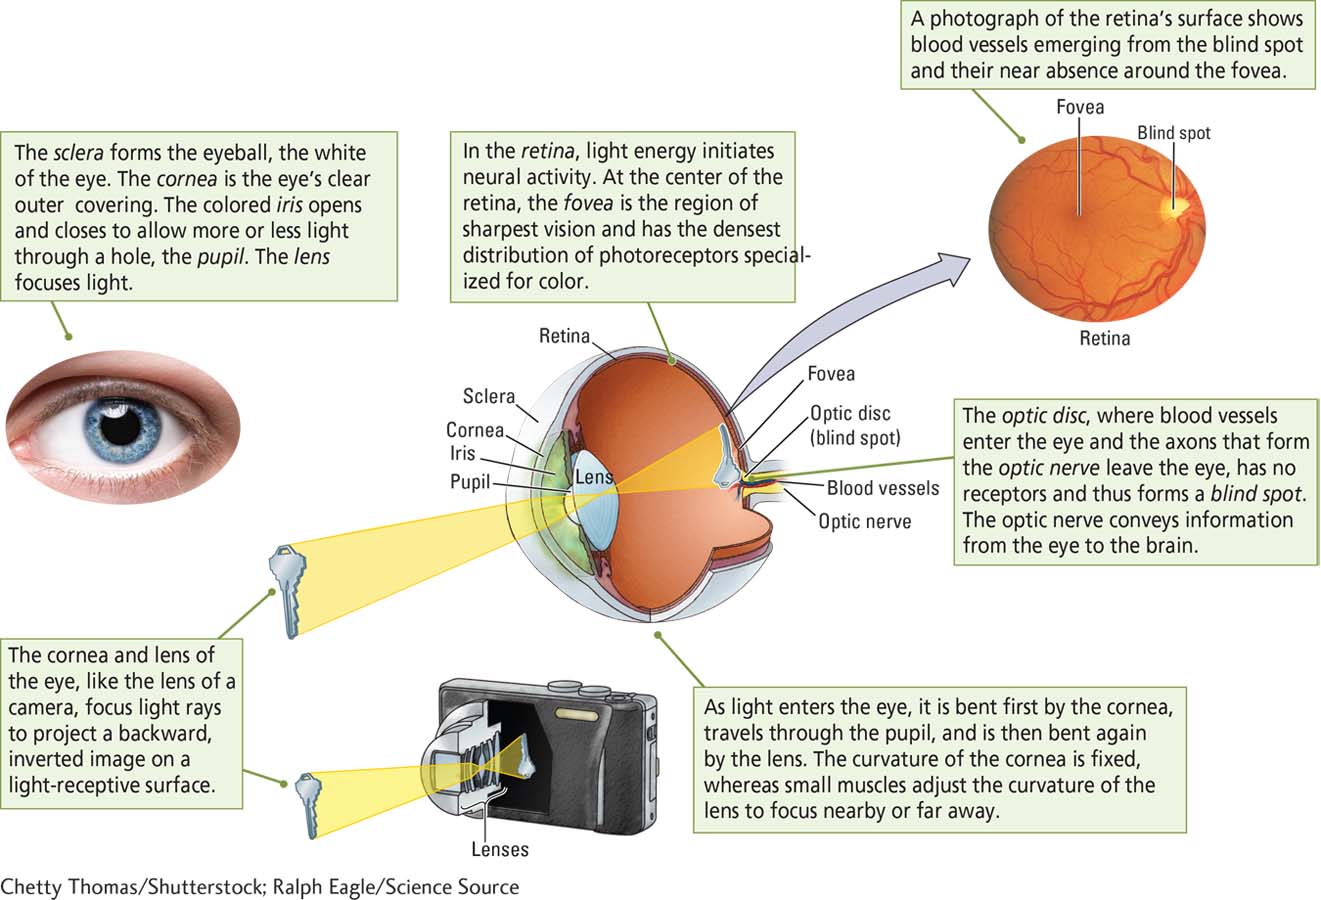
The range of light visible to humans is constrained not by the properties of light waves but rather by the properties of our visual receptors. How do photoreceptor cells in the retina absorb light energy and initiate the processes leading to vision? How the Eye Works illustrates the eye’s structure and shows how its design captures and focuses light.
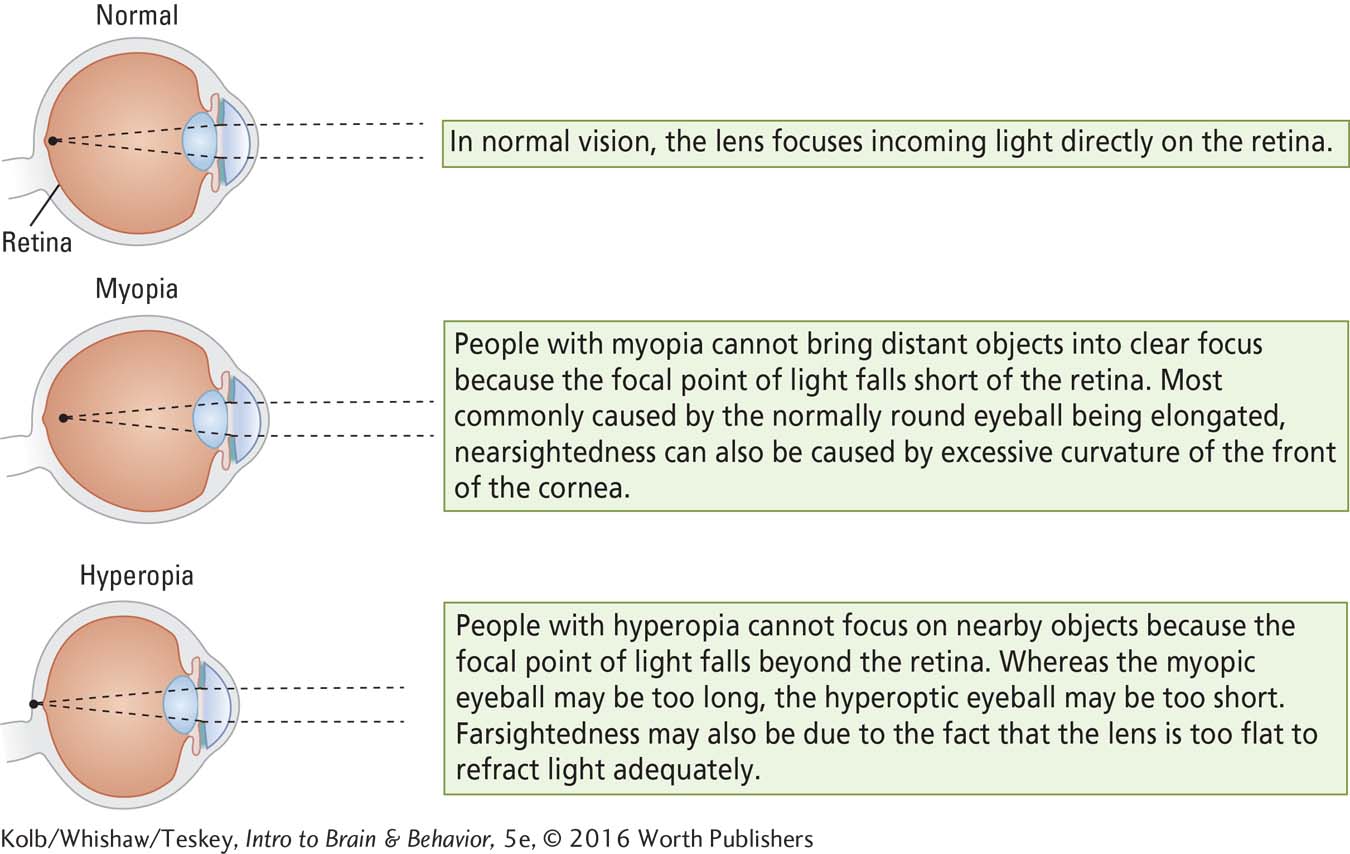
Optical Errors of Refraction
A web of muscles adjusts the shape of the eye’s lens to bend light to greater or lesser degrees, which allows near or far images to be focused on the retina. When images are not properly focused, we need corrective lenses.
The eye, like a camera, works correctly only when sufficient light passes through the lens and is focused on the receptor surface—
Myopia (nearsightedness) afflicts about 50 percent of young people in the developed world. Hyperopia (farsightedness) is a less common refractive error, but as people age, the lens loses its elasticity and consequently becomes unable to refract light from nearby objects correctly. This form of hyperopia, called presbyopia (old-
It is also common to see young children wearing corrective lenses. The incidence of myopia in the United States has doubled in the past 40 years to about 42 percent. It is even higher in Northern Europe (50 percent) and Asia (50 percent to 80 percent). Two factors probably account for the increase.
First, more young people are attending school longer and thus are doing more close work, especially reading. Close work strains the eye muscles. Second, people are spending less and less time outdoors in bright light. Bright light makes the pupil contract, which improves visual depth of field: your eyes focus better. Children should probably spend at least 2 hours each day outside in bright light. Consider that myopia is less common in countries such as Australia (17 percent), where bright light is plentiful.
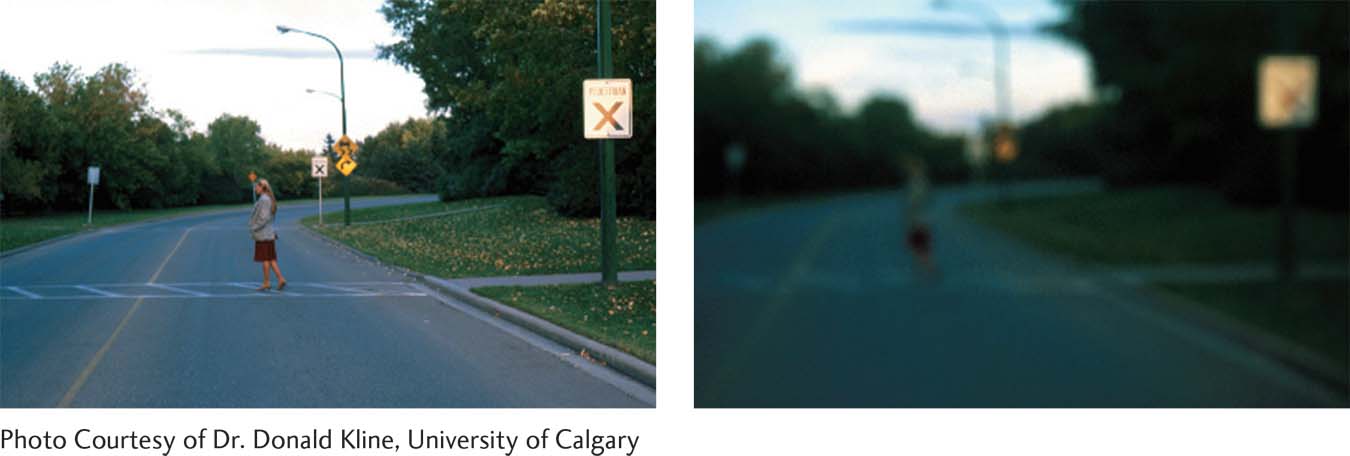
The lesson is that our vision is better in the center of the visual field than at the margins, or periphery. Letters at the periphery must be much larger than those in the center for us to see them as well. Figure 9-3 shows that the retinal surface is depressed at the fovea. This depression is formed because many optic nerve fibers skirt the fovea to facilitate light access to its receptors.
Blind Spot
Now try another experiment. Stand with your head over a tabletop and hold a pencil in your hand. Close one eye. Stare at the edge of the tabletop nearest you. Now hold the pencil in a horizontal position and move it along the edge of the table, with the eraser on the table. Beginning at a point approximately below your nose, move the pencil slowly along the table in the direction of the open eye.
When you have moved the pencil about 6 inches, the eraser will vanish. You have found your blind spot, a small area of the retina also known as the optic disc. This is the area where blood vessels enter and exit the eye and where fibers leading from retinal neurons form the optic nerve, which goes to the brain. There are therefore no photoreceptors in this part of the retina. You can use Figure 9-4 to demonstrate the blind spot in another way.
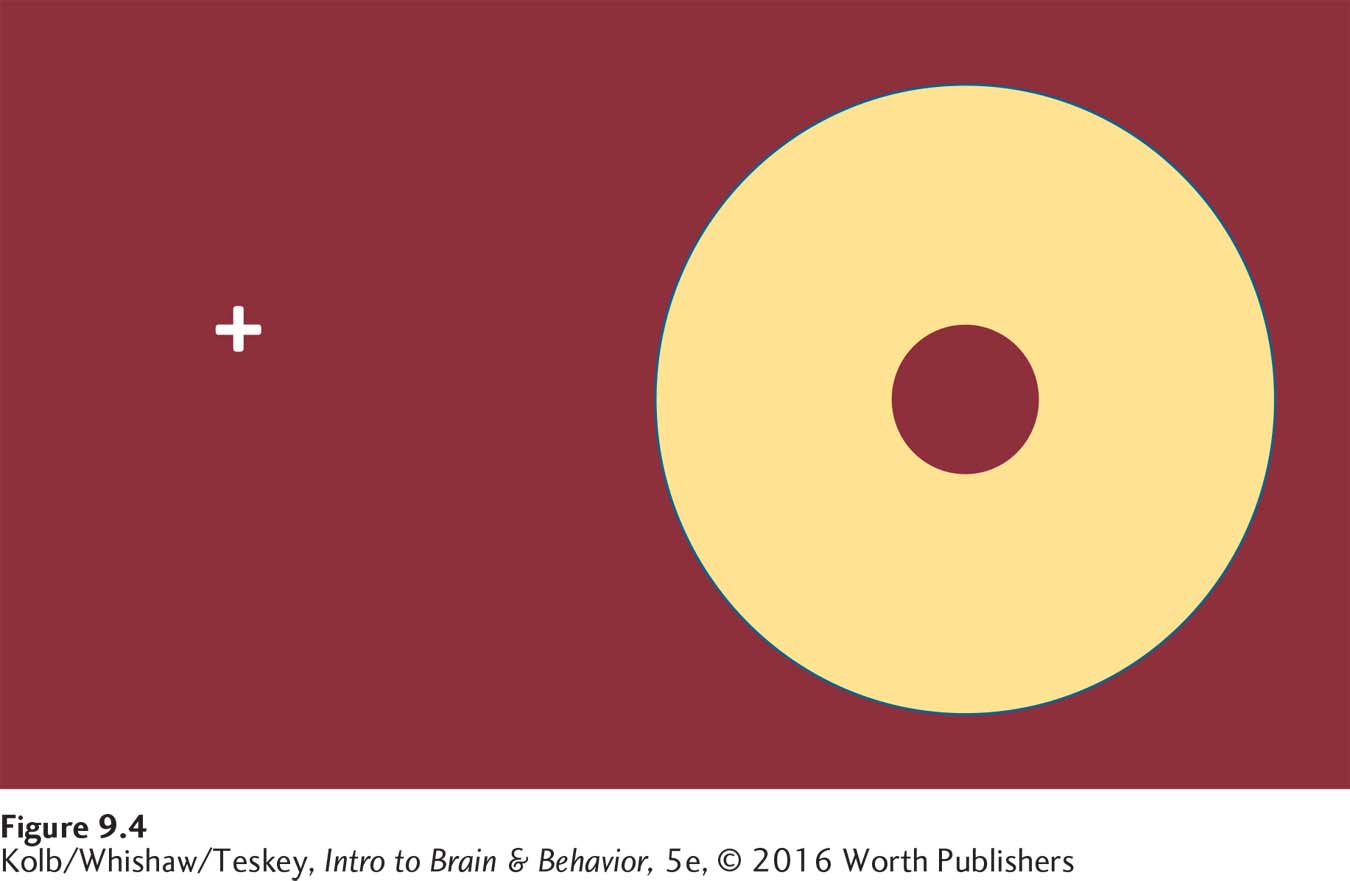
Fortunately, your visual system solves the blind spot problem: your optic disc is in a different location in each eye. The optic disc is lateral to the fovea in each eye, which means that it is left of the fovea in the left eye and right of the fovea in the right eye. Because the two eyes’ visual fields overlap, the right eye can see the left eye’s blind spot and vice versa.
Using both eyes together, then, you can see the whole visual world. For people blind in one eye, the sightless eye cannot compensate for the blind spot in the functioning eye. Still, the visual system compensates for the blind spot in several other ways, and so these people have no sense of a hole in their field of vision.
The blind spot is of particular importance in neurology. It allows neurologists to indirectly view the condition of the optic nerve while providing a window on events in the brain. If intracranial pressure increases, as occurs with a tumor or brain abscess (an infection), the optic disc swells, leading to papilledema (swollen disc). The swelling occurs in part because, like all neural tissue, the optic nerve is surrounded by cerebrospinal fluid. Pressure inside the cranium can displace CSF around the optic nerve, causing swelling at the optic disc.
Another cause of papilledema is inflammation of the optic nerve itself, a condition known as optic neuritis. Whatever the cause, a person with a swollen optic disc usually loses vision owing to pressure on the optic nerve. If the swelling is due to optic neuritis, probably the most common neurological visual disorder, the prognosis for recovery is good.
Photoreceptors
The retina’s photoreceptor cells convert light energy first into chemical energy and then into neural activity. Light striking a photoreceptor triggers a series of chemical reactions that lead to a change in membrane potential (electrical charge) that in turn leads to a change in the release of neurotransmitter onto nearby neurons.
Rods and cones, the two types of photoreceptors shown in Figure 9-5, differ in many ways. They are structurally different. Rods are longer than cones and cylindrical at one end, whereas cones have a tapered end. Rods are more numerous than cones; are sensitive to low levels of brightness (luminance), especially in dim light; and function mainly for night vision (see Clinical Focus 9-2, Visual Illuminance). Cones do not respond to dim light, but they are highly responsive to bright light. Cones mediate both color vision and our ability to see fine detail (visual acuity).
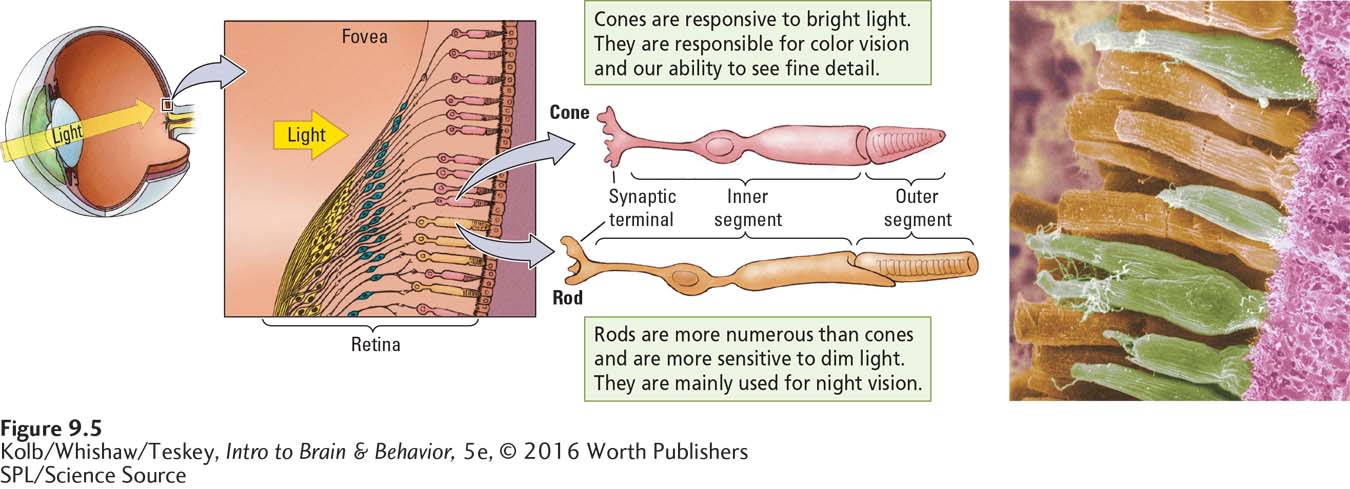
Rods and cones are unevenly distributed over the retina. The fovea has only cones, but their density drops dramatically beyond the fovea. For this reason, our vision is not so sharp at the edges of the visual field, as demonstrated in Figure 9-3.
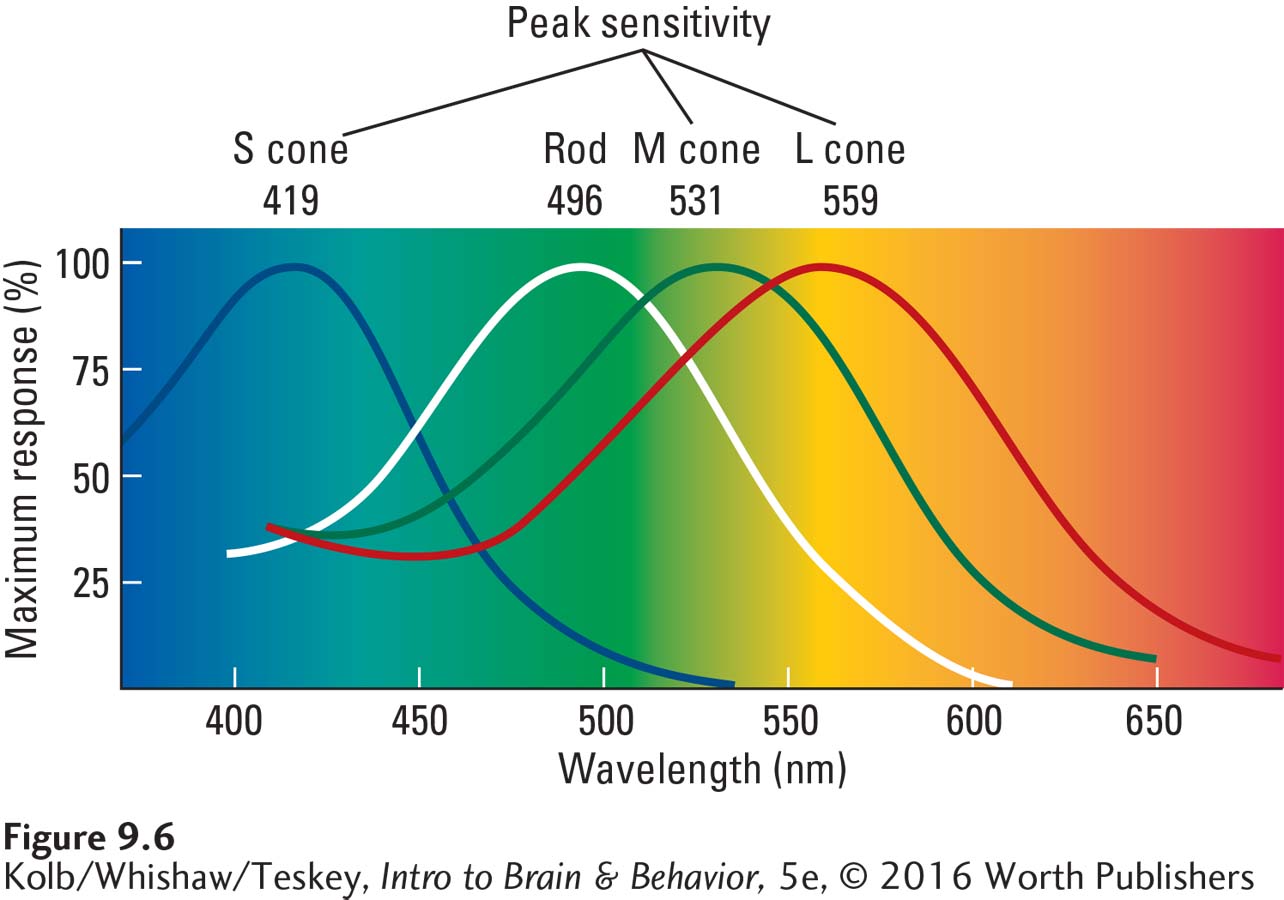
A final difference between rods and cones is in their light-
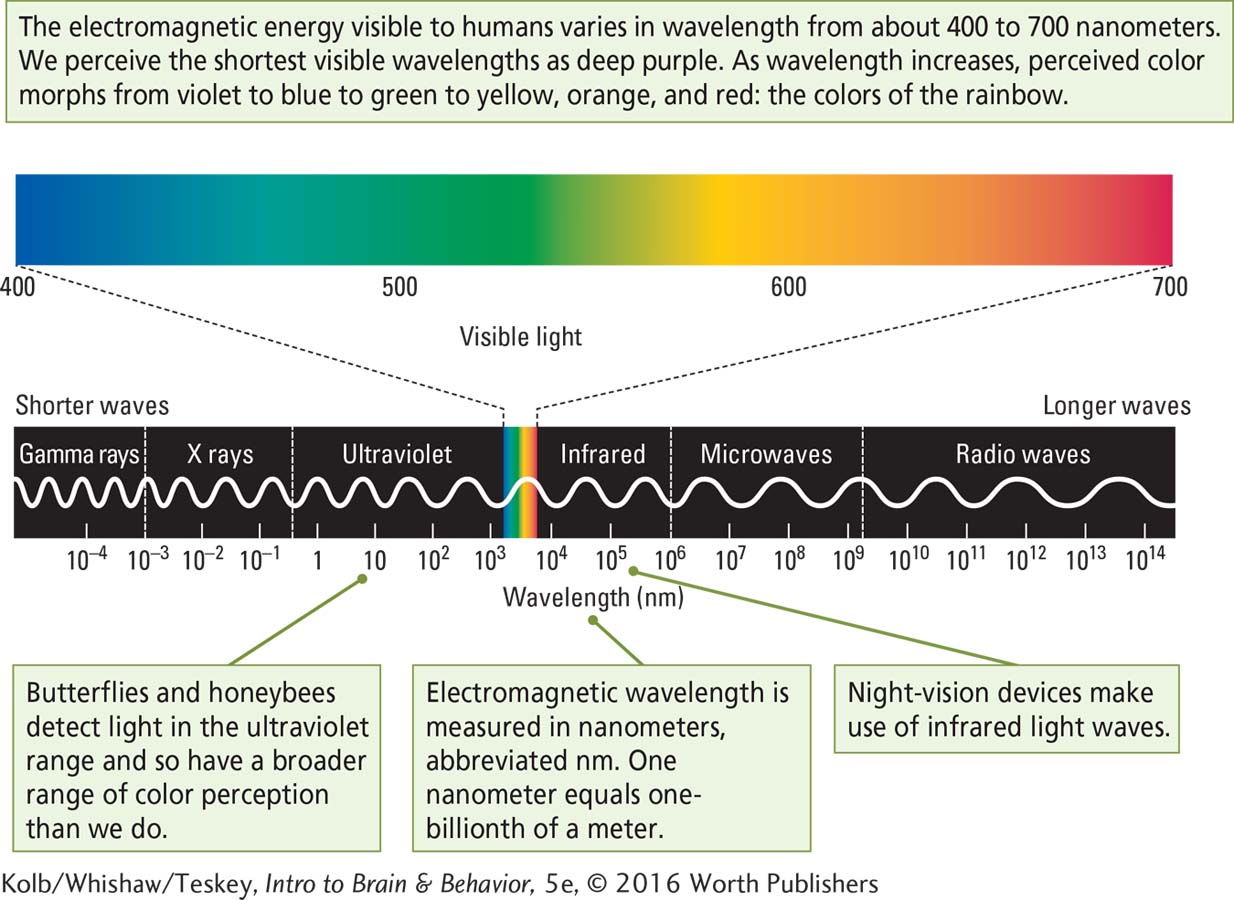
A nanometer (nm) is one-
As shown on the spectrum in Figure 9-6, however, if you were to look at lights with wavelengths of 419, 531, and 559 nanometers (nm), they would not appear blue, green, and red but rather blue-
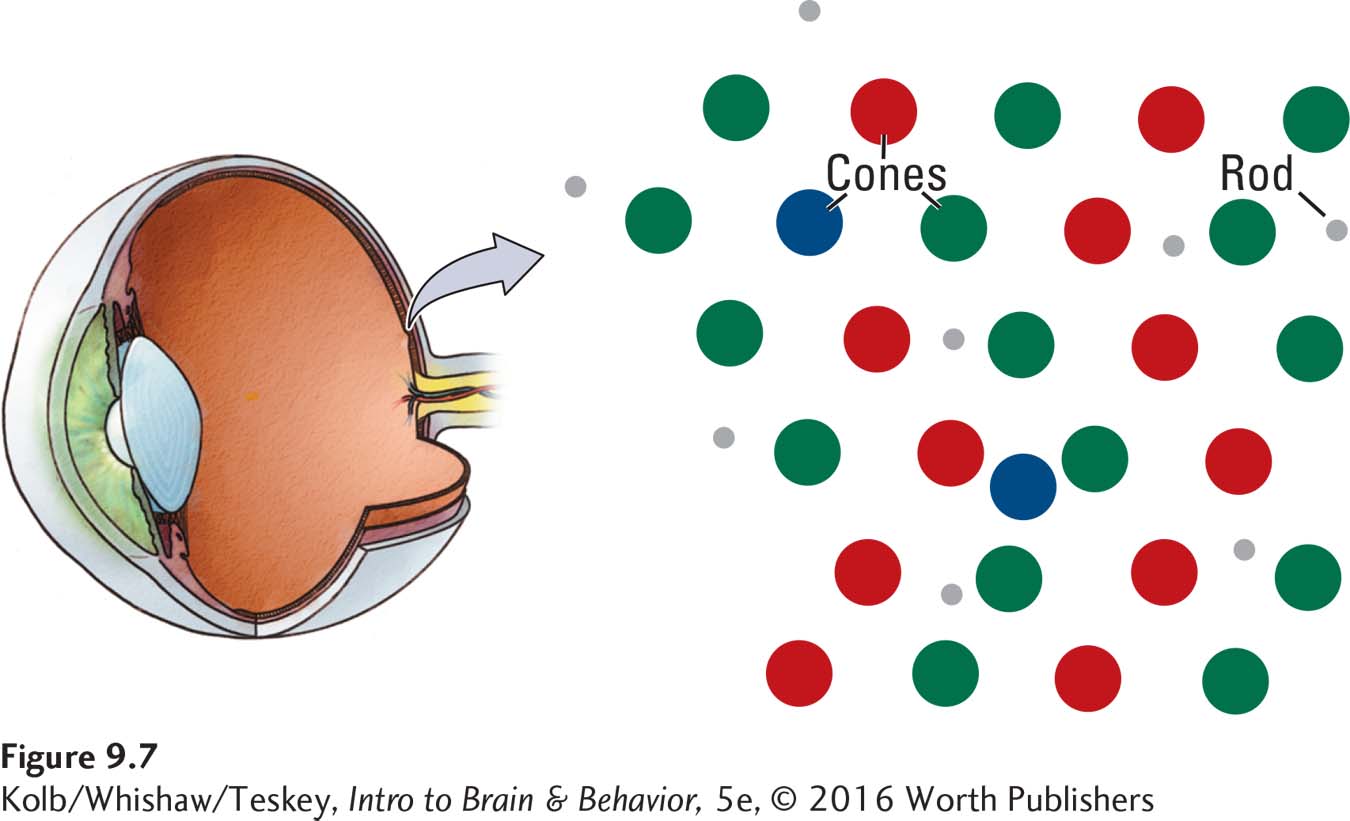
Both the presence of three cone receptor types and their relative numbers and distribution across the retina contribute to our perception of color. As Figure 9-7 shows, the three cone types are distributed more or less randomly across the retina, making our ability to perceive different colors fairly constant across the visual field. The numbers of red and green cones are approximately equal, but blue cones are fewer. As a result, we are not as sensitive to wavelengths in the blue part of the visible spectrum as we are to red and green wavelengths.
9-2
Visual Illuminance
The eye, like a camera, works correctly only when sufficient light passes through the lens and is focused on the receptor surface—
Visual illuminance is typically a complication of aging eyes, It cannot be cured by corrective lenses. As we age, the eye’s lens and cornea allow less light through, so less light strikes the retina. Don Kline (1994) estimated that between ages 20 and 40, people’s ability to see in dim light drops by 50 percent; and by a further 50 percent over every 20 additional years. As a result, seeing in dim light becomes increasingly difficult, especially at night.
The only solution to compensate for visual illuminance is to increase lighting. Night vision is especially problematic. Not surprisingly, statistics show a marked drop in the number of people driving at night in each successive decade after age 40.
Other species that have color vision similar to humans’ also have three types of cones with three color pigments. Because of slight variations in these pigments, the exact frequencies of maximum absorption differ among species. For humans, the exact frequencies are not identical with the numbers given earlier, which are an average across mammals. They are actually 426 and 530 nm for the blue and green cones, respectively, and 552 or 557 nm for the red cone. The two peak sensitivity levels of red cones represent the two variants that humans have evolved. The difference in these two red cones appears minuscule, but it does make a functional difference in some females’ color perception.
The gene for the red cone is carried on the X chromosome. Males have only one X chromosome, so they have only one of these genes and only one type of red cone. The situation is more complicated for females, who possess two X chromosomes. Although most women have only one type of red cone, those who have both are more sensitive than the rest of us to color differences at the red end of the spectrum. We could say that women who have both red cone types have a slightly rosier view of the world: their color receptors construct a world with a richer range of red experiences. But they also have to contend with seemingly peculiar color coordination by others.
Types of Retinal Neurons
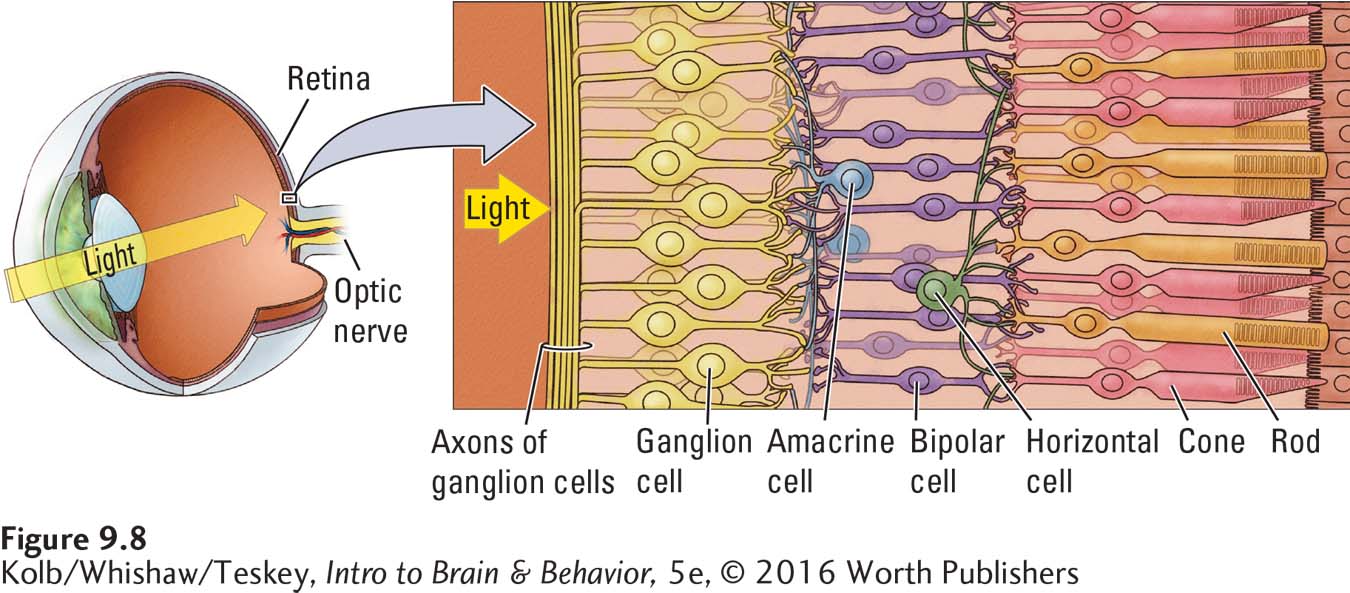
Photoreceptors are connected to two layers of retinal neurons. In the procession from the rods and cones toward the brain shown in Figure 9-8, the first layer contains three cell types: bipolar, horizontal, and amacrine. Horizontal cells link photoreceptors with bipolar cells, whereas amacrine cells link bipolar cells with cells in the second neural layer, the retinal ganglion cells (RGCs). RGC axons collect in a bundle at the optic disc and leave the eye to form the optic nerve.
In Latin, magno means large and parvo means small.
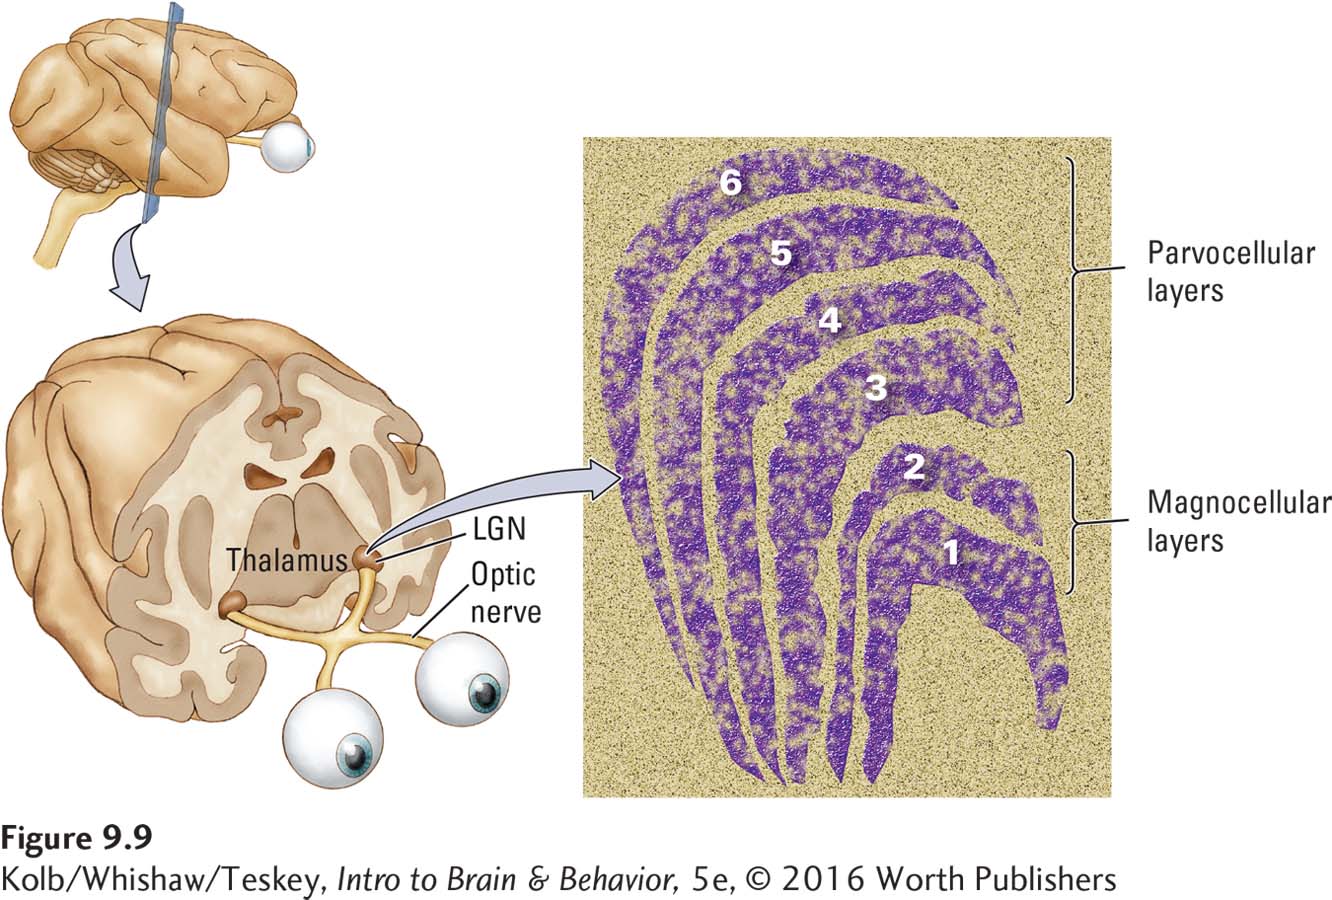
Retinal ganglion cells fall into two major categories, called M and P cells in the primate retina. The designations derive from the distinctly different cell populations in the visual thalamus to which these two classes of RGCs send their axons. As shown in Figure 9-9, one population consists of magnocellular cells (hence M); the other consists of parvocellular cells (hence P). The larger M cells receive their input primarily from rods and so are sensitive to light but not to color. The smaller P cells receive their input primarily from cones and so are sensitive to color.
M cells are found throughout the retina, including the periphery, where we are sensitive to movement but not to color or fine detail. P cells are found largely in the region of the fovea, where we are sensitive to color and fine details. As we follow the ganglion cell axons into the brain, you will see that these two categories of RGCs maintain their distinctiveness throughout the visual pathways.
Visual Pathways
RGCs form the optic nerve, the road into the brain. This road forks off to several places. The destinations of these branches give us clues to what the brain is doing with visual input and how the brain constructs our visual world.
The optic chiasm gets its name from the shape of the Greek letter chi (χ) (pronounced ki).
Crossing the Optic Chiasm
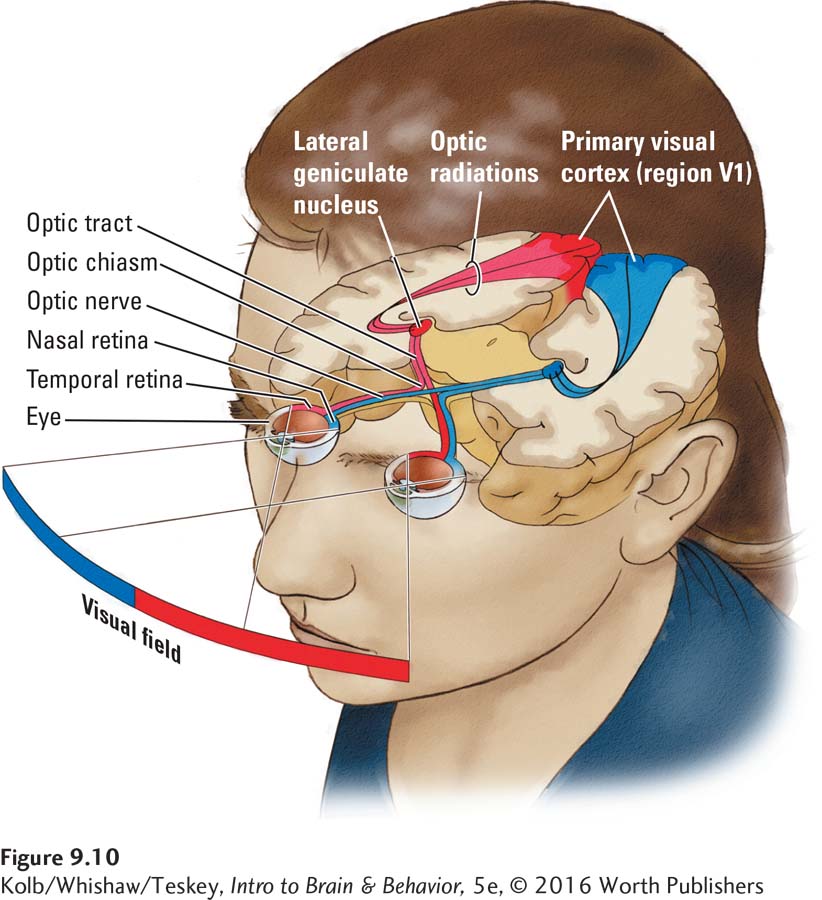
We begin with the optic nerves, one exiting from each eye. Just before entering the brain, the optic nerves partly cross, forming the optic chiasm.
By connecting both eyes with both hemispheres, our visual system represents the world seen through two eyes as a single perception.
About half the fibers from each eye cross in such a way that the left half of each optic nerve goes to the left side of the brain, and the right half goes to the brain’s right side, as diagrammed in Figure 9-10. The medial path of each retina, the nasal retina, crosses to the opposite side. The lateral path, the temporal retina, travels straight back on the same side. Because light that falls on the right half of each retina actually comes from the left side of the visual field, information from the left visual field goes to the brain’s right hemisphere, and information from the right visual field goes to the left hemisphere. Thus, half of each retina’s visual field is represented on each side of the brain.
Three Routes to the Visual Brain
Two main pathways lead to the visual cortex in the occipital lobe: the geniculostriate pathway for processing the object’s image and the tectopulvinar pathway for directing rapid eye movements. Another smaller pathway tracks into the hypothalamus.
GENICULOSTRIATE SYSTEM On entering the brain, the RGC axons separate, forming the two distinct pathways shown in Figure 9-11. All of the P ganglion axons and some of the M ganglion axons form a pathway called the geniculostriate system. This pathway goes from the retina to the lateral geniculate nucleus (LGN) of the thalamus and then to layer IV of the primary visual cortex in the occipital lobe.
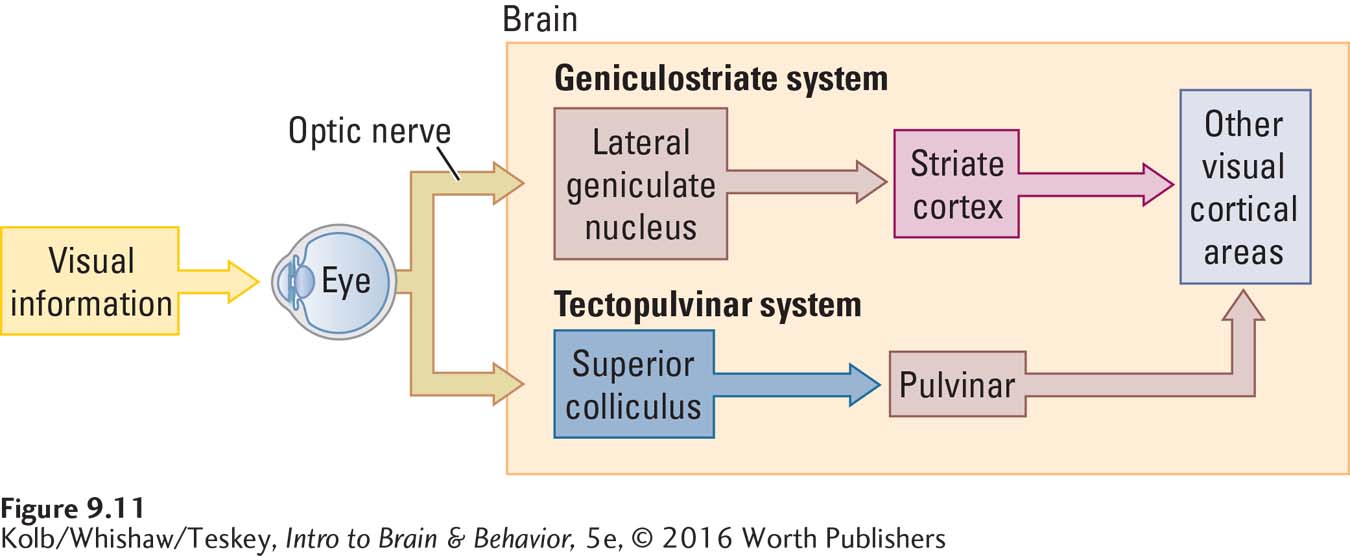
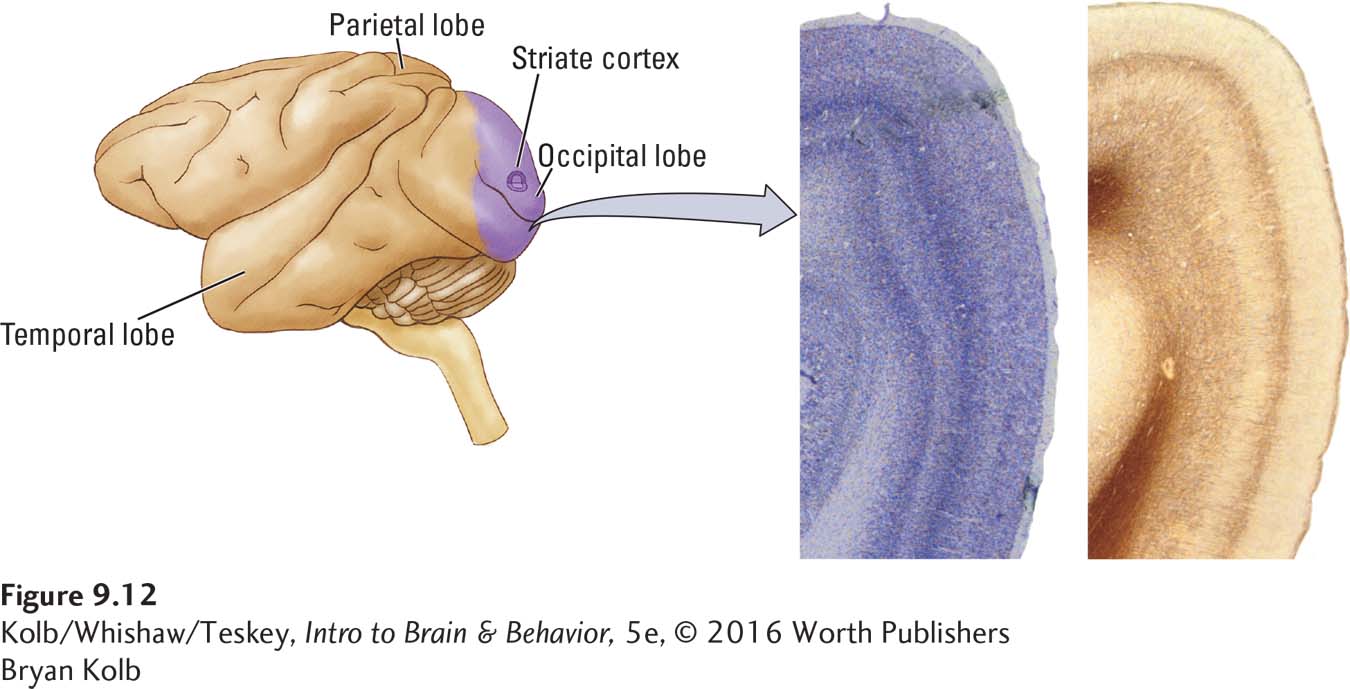
When stained, the primary visual cortex shows a broad stripe across it in layer IV and so is known as striate (striped) cortex (Figure 9-12). The geniculostriate system therefore bridges the thalamus (geniculate) and the striate cortex. From the striate cortex, the axon pathway divides. One route goes to vision-
TECTOPULVINAR SYSTEM The second pathway leading from the eye is formed by the axons of the remaining M ganglion cells. These cells send their axons to the midbrain’s superior colliculus, which sends connections to the pulvinar region of the thalamus. This pathway is therefore known as the tectopulvinar system because it runs from the eye through the midbrain tectum to the pulvinar (see Figure 9-11). The pulvinar sends connections to the parietal and temporal lobes, bypassing the occipital visual areas.
RETINOHYPOTHALAMIC TRACT Between 1 percent and 3 percent of RGCs are unique in that they are photosensitive: they act as photoreceptors. These pRGCs, which contain the pigment melanopsin, absorb blue light at a wavelength (between 460 and 480 nm) different from the wavelengths of rods or cones (see Figure 9-6). Axons of pRGCs form a small third visual pathway, the retinohypothalamic tract.
Figure 13-6 maps the retinohypothalamic tract into the SCN.
The retinohypothalamic tract synapses in the tiny suprachiasmatic nucleus (SCN) in the hypothalamus, next to the optic chiasm. Photosensitive RGCs participates both in regulating circadian rhythms and in the pupillary reflex that expands and contracts the pupil in response to the amount of light falling on the retina. Farhan Zaidi and colleagues (2007) studied two profoundly blind subjects who lack functional rods and cones. The researchers found that stimulation with 480-
Dorsal and Ventral Visual Streams
The geniculostriate and tectopulvinar pathways extend into the visual brain. Each eventually leads to either the parietal lobe or the temporal lobe. Our next task is to determine the role each lobe plays in building our visual world. As we look at the photograph in Clinical Focus 9-1, we can identify objects, and we can point to them. Identifying and pointing are different functions.
Having identified the temporal lobe and parietal lobe visual pathways, researchers went searching for their possible functions. Why would evolution produce two different destinations for these neural pathways? Each route must produce visual knowledge for a different purpose.
David Milner and Mel Goodale (2006) proposed that these two purposes are to identify a stimulus (the what function) and to control movement to or away from the stimulus (the how function). This what–how distinction came from an analysis of the routes visual information takes when it leaves the striate cortex. Figure 9-13 shows the two distinct visual pathways that originate in the striate cortex, one progressing to the temporal lobe and the other to the parietal lobe. The pathway to the temporal lobe is the ventral stream, whereas the pathway to the parietal lobe is the dorsal stream.
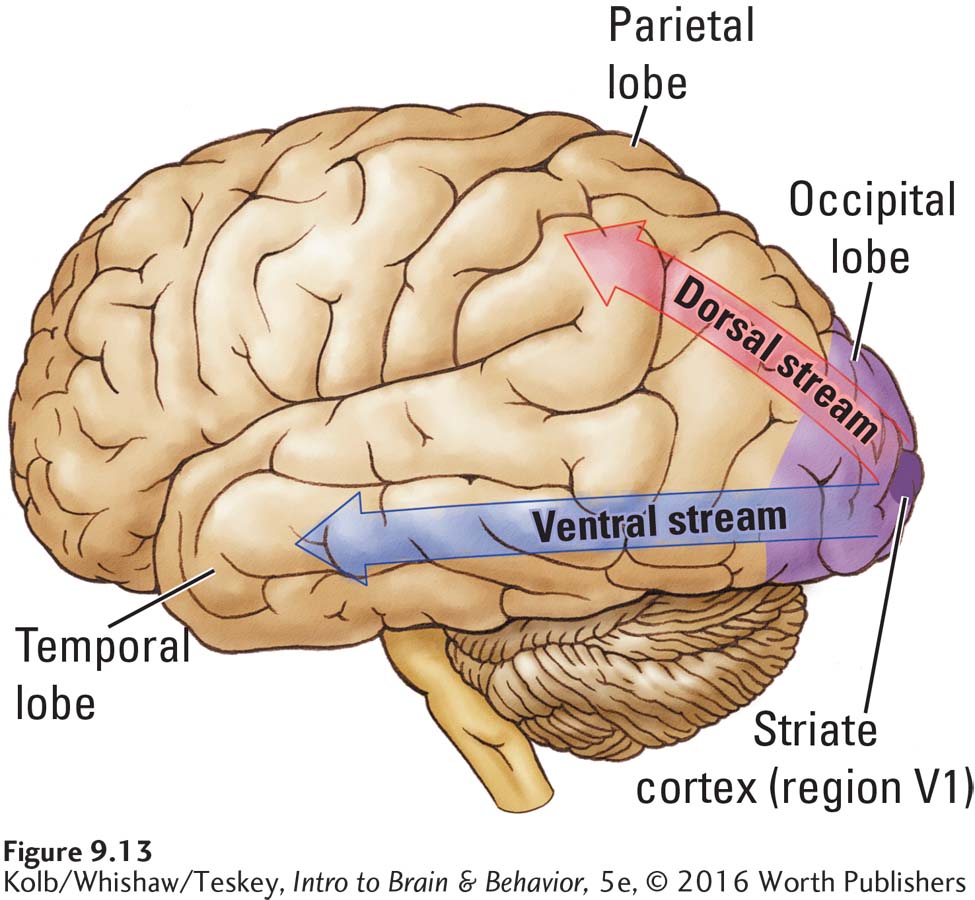
Both the geniculostriate and the tectopulvinar pathways contribute to the dorsal and ventral streams. To understand how the two streams function, we return to the details of how visual input from the eyes contributes to them.
Geniculostriate Pathway
The RGC fibers from the two eyes distribute their connections to the two lateral geniculate nuclei (left and right) of the thalamus. At first glance, this appears to be an unusual arrangement. As seen in Figure 9-10, the fibers from the left half of each retina go to the left LGN; those from the right half of each retina go to the right LGN. But the fibers from each eye do not go to exactly the same LGN location.
Each LGN has six layers, and the projections from the two eyes go to different layers, as illustrated in anatomical context in Figure 9-14. Layers 2, 3, and 5 receive fibers from the ipsilateral eye (the eye on the same side), whereas layers 1, 4, and 6 receive fibers from the contralateral eye (the eye on the opposite side). This arrangement provides both for combining the information from the two eyes and for segregating the information from the P and M ganglion cells.
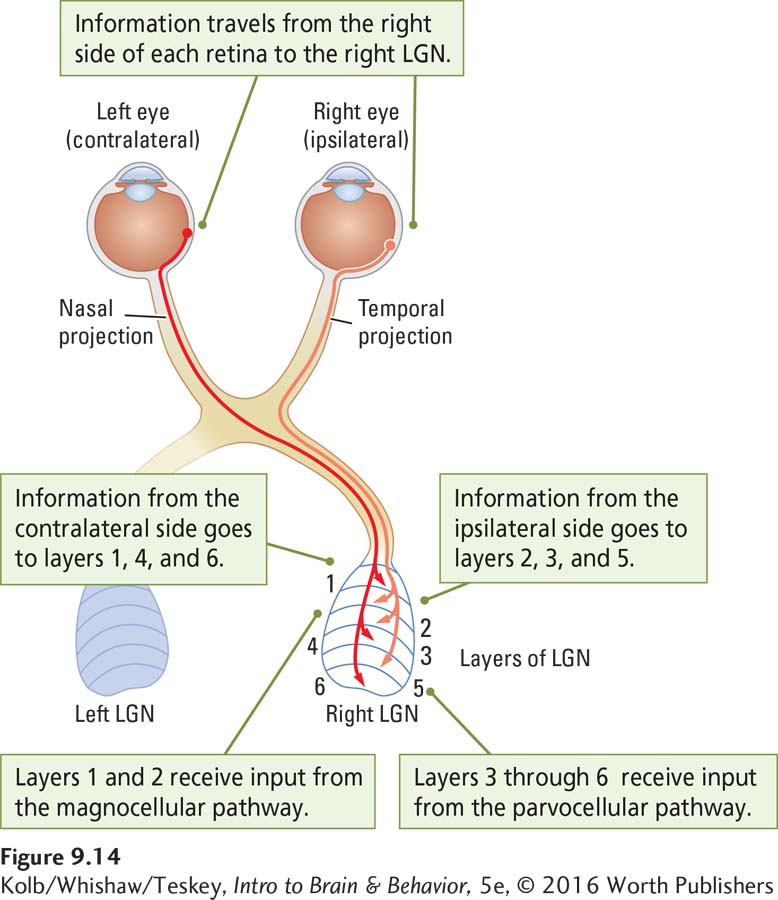
Axons from the P cells go only to layers 3 through 6 (the parvocellular layers). Axons from the M cells go only to layers 1 and 2 (the magnocellular layers). Because the P cells are responsive to color and fine detail, LGN layers 3 through 6 must be processing information about color and form. In contrast, the M cells mostly process information about movement, so layers 1 and 2 must deal with movement.
Figure 2-22 maps layers I through VI in the primary motor and sensory cortices.
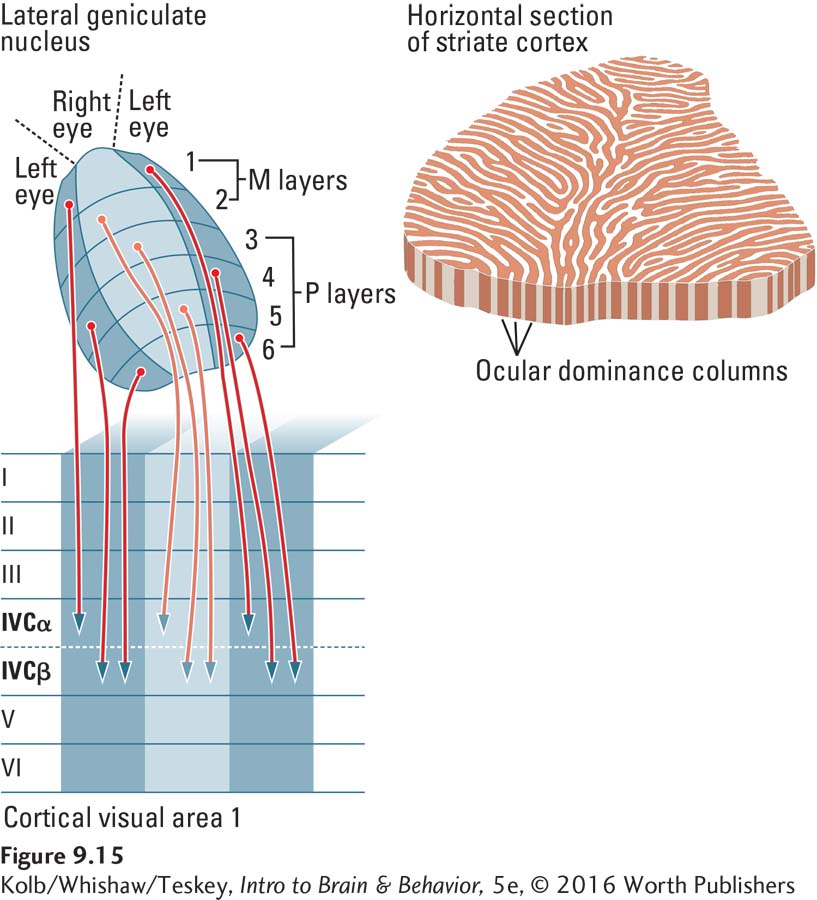
Just as there are six layers in the thalamic LGN (numbered 1 through 6), there are also six layers in the striate cortex (numbered I through VI). That there happen to be six layers in each location is an accident of evolution found in all primate brains. Let us now see where these LGN cells from the thalamus send their connections within the visual cortex.
Layer IV is the main afferent (incoming) layer of the cortex. In the visual cortex, layer IV has several sublayers, two of which are known as IVCα and IVCβ. LGN layers 1 and 2 go to IVCα, and layers 3 through 6 go to IVCβ. A distinction between the P and M functions thus continues in the striate cortex.
As illustrated in Figure 9-15, input from the two eyes also remains separated in the cortex. The input from the ipsilaterally and contralaterally connected parts of the LGN go to adjacent strips of occipital cortex. These strips, which are about 0.5 mm across, are known as cortical columns.
In summary, P and M retinal ganglion cells send separate pathways to the thalamus, and this segregation continues in the striate cortex. The left and right eyes also send separate pathways to the thalamus, and these pathways, too, remain segregated in the striate cortex.
Tectopulvinar Pathway
To review, magnocellular RGCs found throughout the retina receive input primarily from the rods and so are sensitive to light but not to color. M cells in the periphery of the retina are sensitive to movement but not to color or fine details. In the brain, some M cells join P cells to form the geniculostriate pathway. The tectopulvinar pathway is formed by the axons of the remaining M cells.
These M cells send their axons to the superior colliculus in the midbrain’s tectum. One function of the tectum is to produce orienting movements—
Many textbooks emphasize the how pathway as a where function. Because where is both a property of what a stimulus is and a cue for how to control movement, we use Milner and Goodale’s what–
The where function of the tectopulvinar system is useful in understanding D. B.’s blindsight, described in Clinical Focus 9-1. His geniculostriate system was disrupted by surgery, but his tectopulvinar system was not, which allowed him to identify the location of stimuli (where) that he could not identify (what).
Occipital Cortex
Our route down the visual pathways has led us from the retina all the way back to the occipital lobe and into the parietal and temporal lobes. Now we explore how visual information proceeds from the striate cortex through the rest of the occipital lobe to the dorsal and ventral streams.
All mammals have at least one primary cortical area for each sensory system. The primary area relays most information that reaches secondary areas.
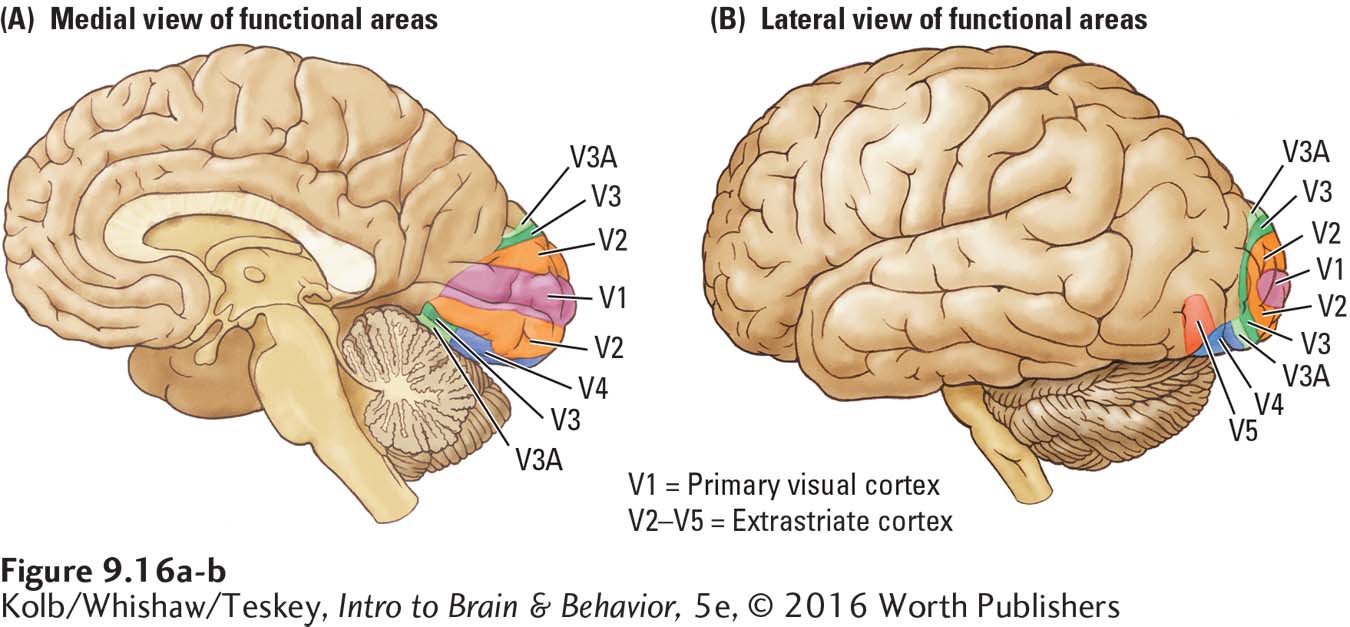
As shown in Figure 9-16, the occipital lobe is composed of at least six visual regions: V1, V2, V3, V3A, V4, and V5. The striate cortex is region V1, the primary visual cortex. The remaining occipital visual areas form the extrastriate cortex, with each region processing specific features of visual information. Because each occipital region has a unique cytoarchitecture (cellular structure) and unique inputs and outputs, we can infer that each must be doing something different from the others.
As shown in Figures 9-12 and 9-15, a remarkable feature of region V1 is its striations—
The heterogeneous cytochrome staining now appears as random blobs in the V1 layers, as diagrammed in Figure 9-17. These darkened regions have in fact become known as blobs, the less-
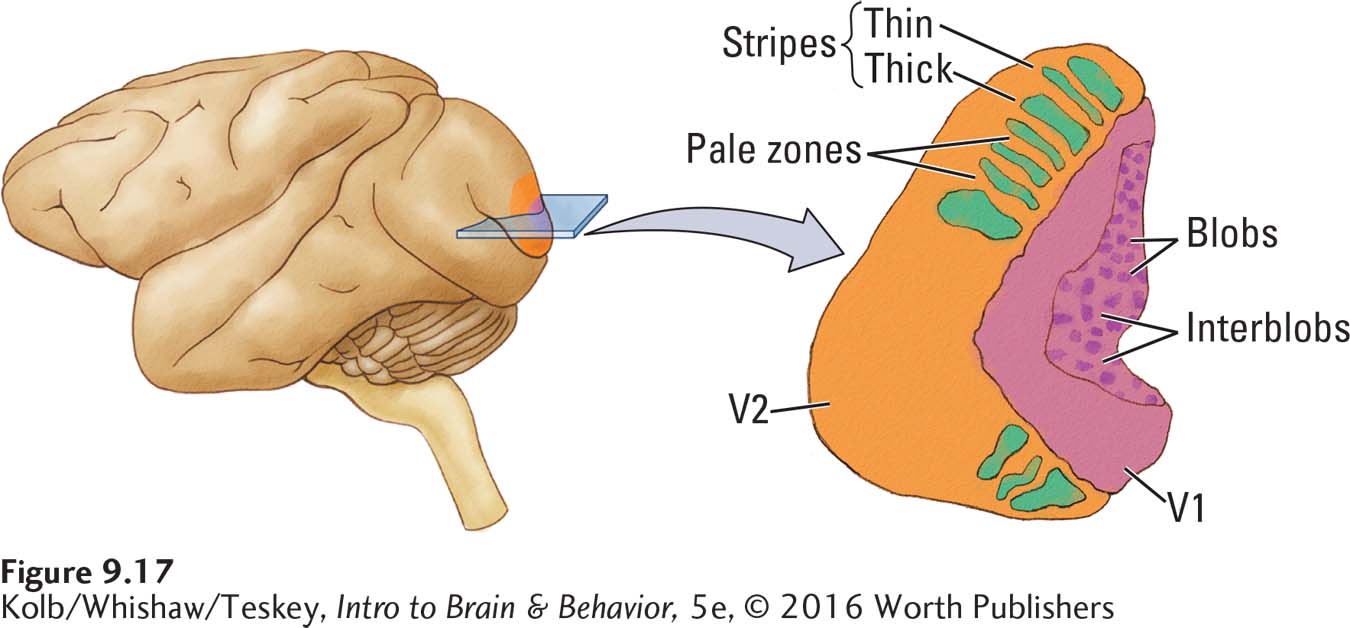
All three types of information move from region V1 to the adjoining region V2. Here, the color, form, and motion inputs remain segregated, again seen through the pattern of cytochrome oxidase staining. But as Figure 9-17 shows, the staining pattern in region V2 differs from that in region V1. Region V2 has a pattern of thick and thin stripes intermixed with pale zones. The thick stripes receive input from the movement-
As charted in Figure 9-18, the visual pathways proceed from region V2 to the other occipital regions and then to the parietal and temporal lobes, forming the dorsal and ventral streams. Although many parietal and temporal regions take part, the major regions are region G in the parietal lobe (thus called region PG) and region E in the temporal lobe (thus called region TE).
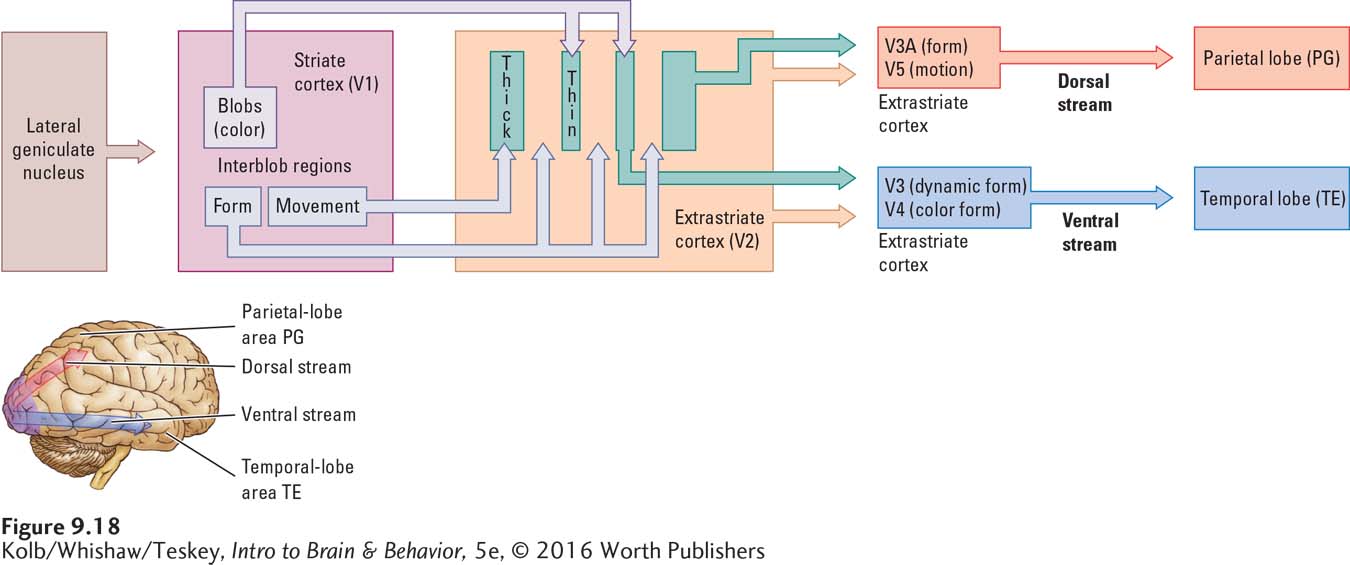
The simple records of color, form, and motion from the occipital regions are assembled in the dorsal and ventral streams to produce a rich, unified visual world of complex objects, such as faces and paintings, and complex skills, such as bike riding and ball catching. We can think of the complex representations of the dorsal and ventral streams as consisting of how functions and what functions. How is looking at, reaching for, and grasping; what is the spoon.
Vision Beyond the Occipital Cortex
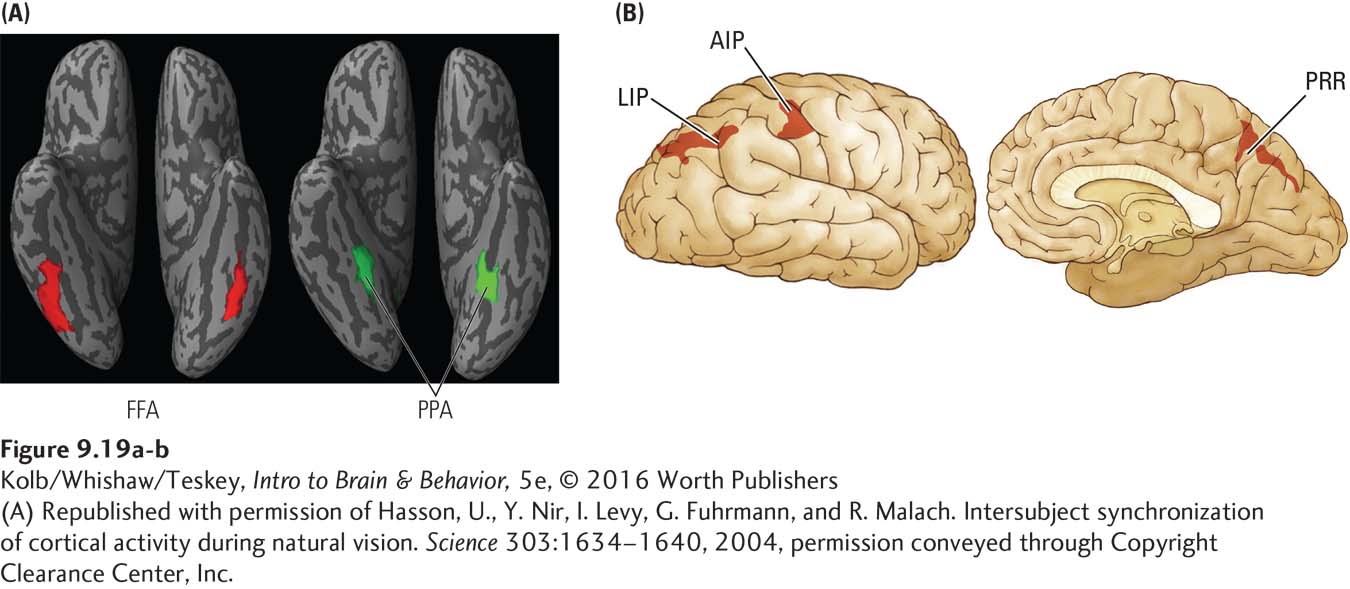
Visual processing that begins in occipital cortex continues via the ventral and dorsal streams into the temporal and parietal visual cortex. Each region has multiple areas specialized for specific visual functions. For example, Figure 9-19A shows two regions on the ventral surface of the temporal lobes. One is specialized for recognizing faces (fusiform face area, or FFA), the other for analyzing landmarks such as buildings or trees (parahippocampal place area, or PPA). As we gaze at the photograph in Clinical Focus 9-1 (p. 284), then, the three faces activate the FFA and the trees engage the PPA. Figure 9-19B shows three regions in the parietal lobe related to eye movements (lateral intraparietal area, or LIP) and visual control of grasping (anterior intraparietal area, or AIP). The parietal reach region (PRR) has a role in visually guided reaching movements.
Literally, agnosia means not knowing. Section 15-7 ties conditions like agnosia to the search for a neural basis of consciousness.
Damage to these regions can produce surprisingly specific deficits. For example, damage to the FFA leads to facial agnosia, or prosopagnosia, a condition in which an individual cannot recognize faces. We saw one patient with prosopagnosia so severe that she could not recognize her identical twin sister’s face. Curiously, her other visual functions seemed to be normal.
9-2 REVIEW
The Visual System’s Functional Anatomy
Before you continue, check your understanding.
Question 1
Neurons that project into the brain from the retina and form the optic nerve are called ____________ .
Question 2
____________ retinal ganglion cells receive input mostly from cones and carry information about color and fine detail, whereas ____________ retinal ganglion cells receive input mostly from rods and carry information about light but not color.
Question 3
The two major pathways from the retina into the brain are ____________ and ____________.
Question 4
Damage to the fusiform face area in the temporal lobe can produce ____________.
Question 5
Contrast the paths and functions of the dorsal and ventral streams.
Answers appear in the Self Test section of the book.