9-4 Neuronal Activity
Individual neurons make up the visual system pathways. By studying how these cells behave when their receptive fields are stimulated, we can begin to understand how the brain processes the features of the visual world beyond the location of a light. We first examine how neurons in the ventral stream respond to objects’ shapes and colors, then briefly consider how neurons in the dorsal stream direct vision for action.
Seeing Shape
Imagine a microelectrode placed near a neuron somewhere in the visual pathway from retina to cortex. The microelectrode is recording changes in the neuron’s firing rate. This cell occasionally fires spontaneously, producing action potentials with each discharge. Assume that the neuron discharges, on average, once every 0.08 second. Each action potential is brief, on the order of 1 millisecond.
Figure 4-6 diagrams how microelectrodes work.
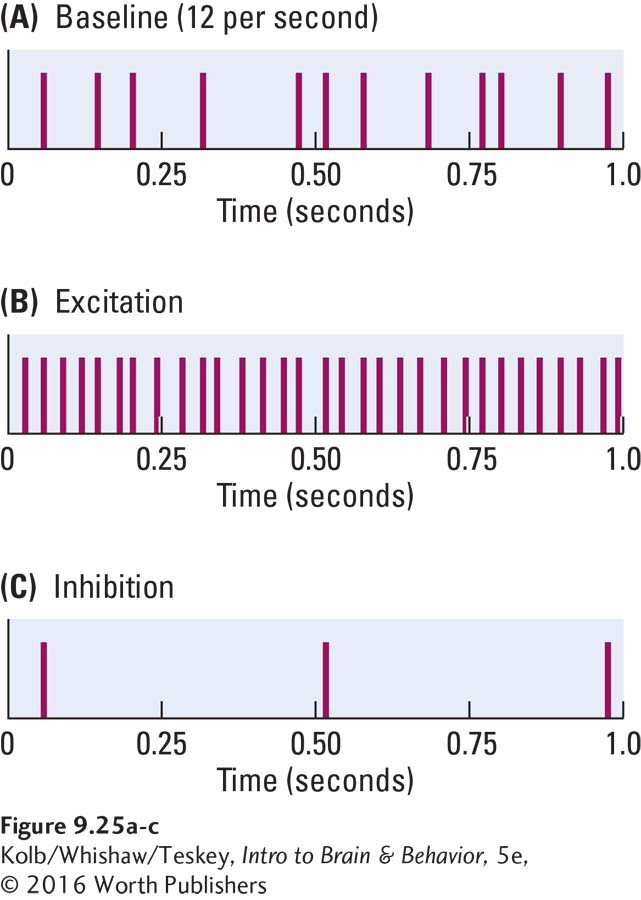
If we plot action potentials spanning 1 s, we see only spikes in the record because the action potentials are so brief. Figure 9-25A is a single cell recording of 12 spikes in the span of 1 second. If the firing rate of this cell increases, we see more spikes (Figure 9-25B). If the firing rate decreases, we see fewer spikes (Figure 9-25C). The increase in firing is the result of neuronal excitation, whereas the decrease indicates inhibition. Excitation and inhibition, of course, are the principal information transfer mechanisms in the nervous system.
Now suppose we present a stimulus to the neuron by illuminating its receptive field in the retina, perhaps by shining a light on a blank screen within the cell’s visual field. We might place before the eye a straight line positioned at a 45° angle. The cell could respond to this stimulus either by increasing or decreasing its firing rate. In either case, we would conclude that the cell is generating information about the line.
The same cell could show excitation to one stimulus, inhibition to another stimulus, and no reaction at all to a third. The cell could be excited by lines oriented 45° to the left and inhibited by lines oriented 45° to the right. Similarly, the cell could be excited by stimulation in one part of its receptive field (such as the center) and inhibited by stimulation in another part (such as the periphery).
Finally, we might find that the cell’s response to a particular stimulus is selective. Such a cell would be telling us about the importance of the stimulus to the animal. For instance, the cell might be excited when a stimulus is presented with food but inhibited when the same stimulus is presented alone. In each case, the cell is selectively sensitive to characteristics in the visual world.
Neurons at each level of the visual system have distinctly different characteristics and functions. Our goal is not to look at each neuron type but rather to consider generally how some typical neurons at each level differ from one another in their contributions to processing shape. We focus on neurons in three areas: the ganglion cell layer of the retina, the primary visual cortex, and the temporal cortex.
Processing in RGCs
Neurons in the retina do not detect shape, because their receptive fields are minuscule dots. Each retinal ganglion cell responds only to the presence or absence of light in its receptive field, not to shape. Shape is constructed by processes in the cortex from the information that those ganglion cells pass on about events in their receptive fields.
The receptive field of a ganglion cell has a concentric circle arrangement, as illustrated in Figure 9-26A. A spot of light falling in the receptive field’s central circle excites some of these cells, whereas a spot of light falling in the receptive field’s surround (periphery) inhibits the cell. A spot of light falling across the entire receptive field weakly increases the cell’s firing rate.
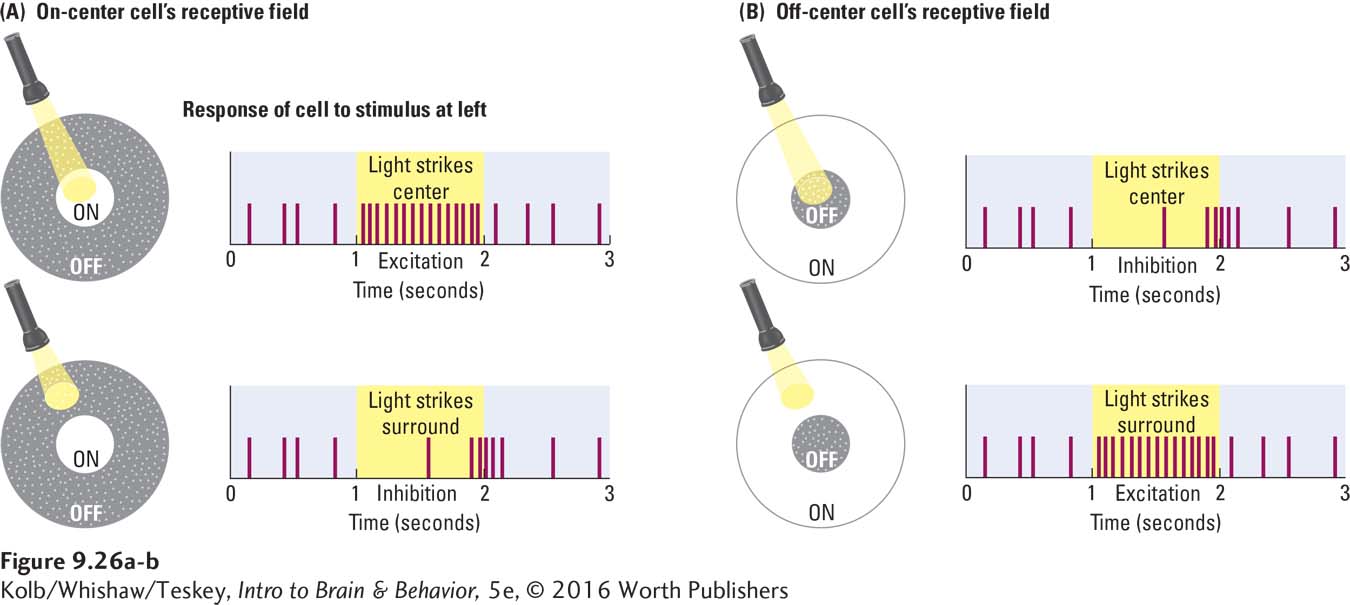
This type of neuron is called an on-
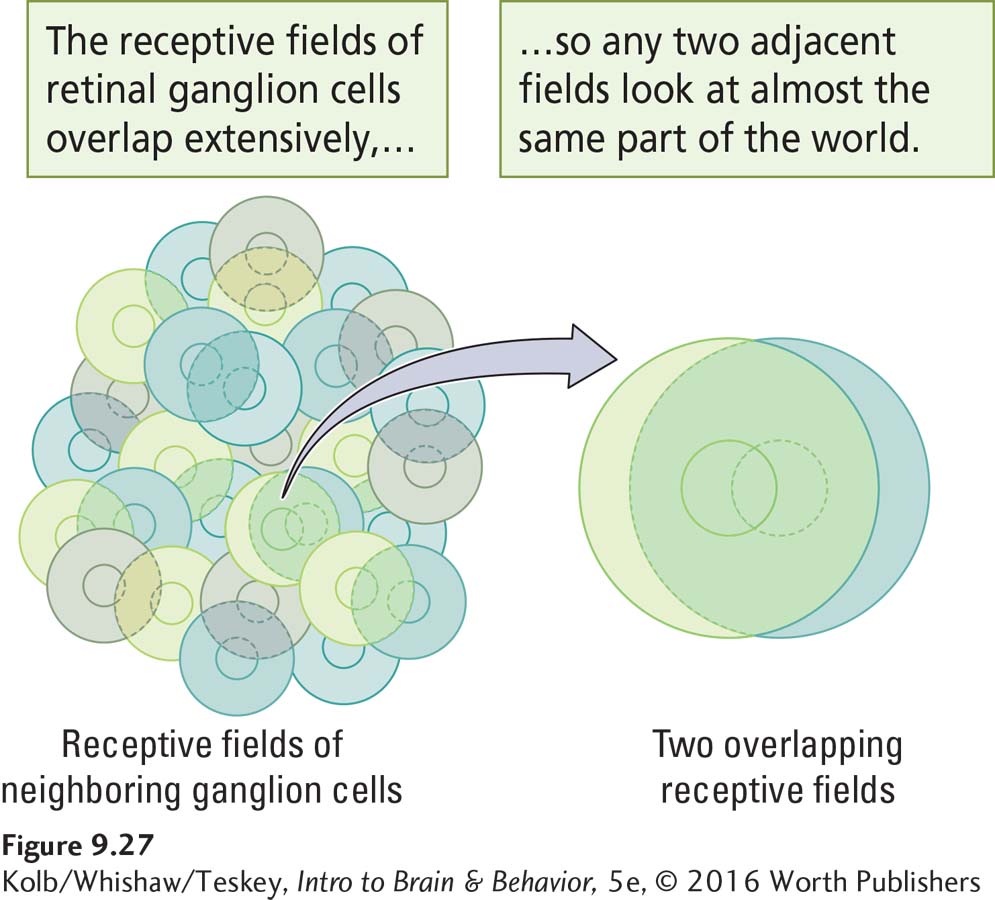
This description of ganglion cell receptive fields might mislead you into thinking that they form a mosaic of discrete little circles on the retina. In fact, neighboring retinal ganglion cells receive their inputs from an overlapping set of photoreceptors. As a result, their receptive fields overlap, as illustrated in Figure 9-27. In this way, a small spot of light shining on the retina is likely to produce activity in both on-
How can on-
To understand how luminance contrast tells the brain about shape, consider the hypothetical population of on-
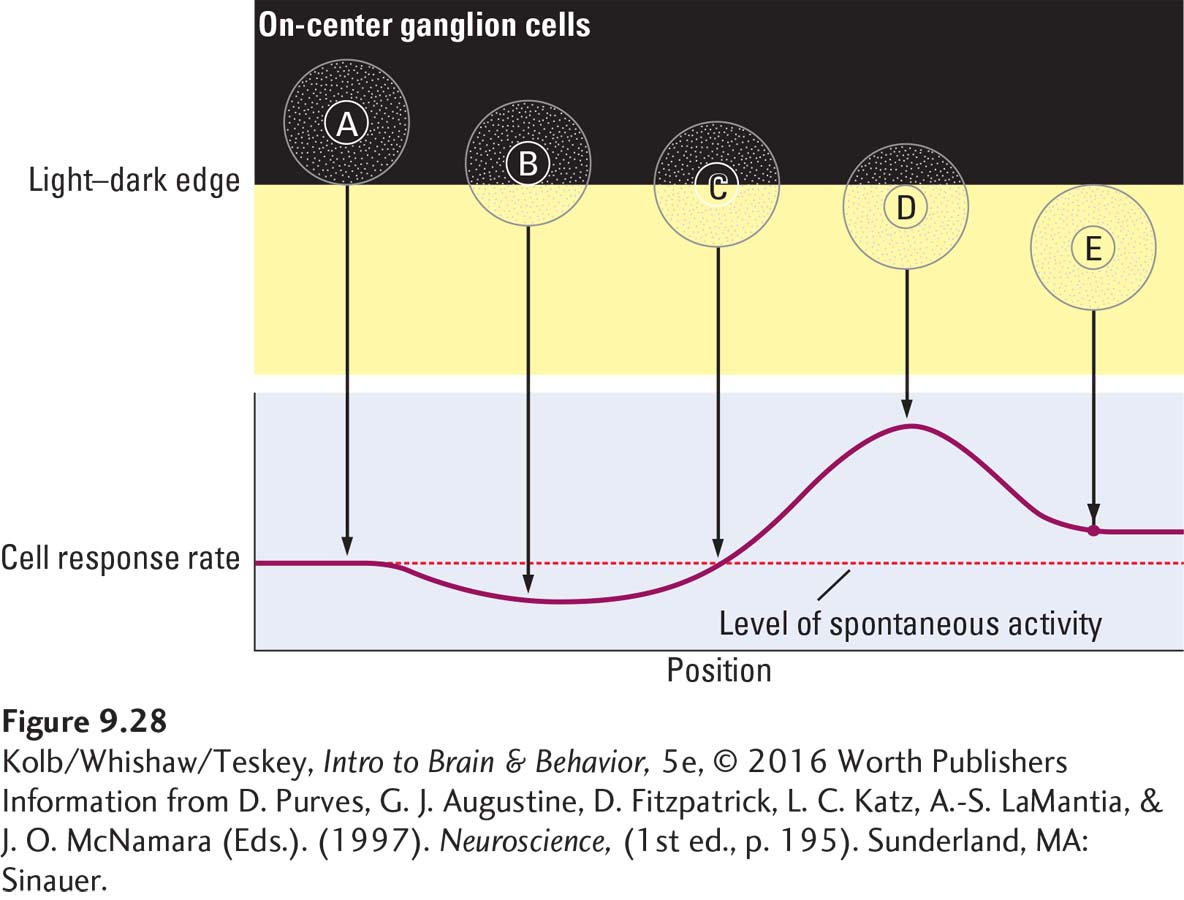
The ganglion cells with receptive fields in the dark or light areas are least affected because they receive either no stimulation or stimulation of both the excitatory and the inhibitory regions of their receptive fields. The ganglion cells most affected by the stimulus are those lying along the edge. Ganglion cell B is inhibited because the light falls mostly on its inhibitory surround, and ganglion cell D is excited because its entire excitatory center is stimulated but only part of its inhibitory surround is.
Consequently, information transmitted from retinal ganglion cells to the visual areas in the brain does not give equal weight to all visual field regions. Rather, it emphasizes regions containing differences in luminance—
Processing Shape in the Primary Visual Cortex
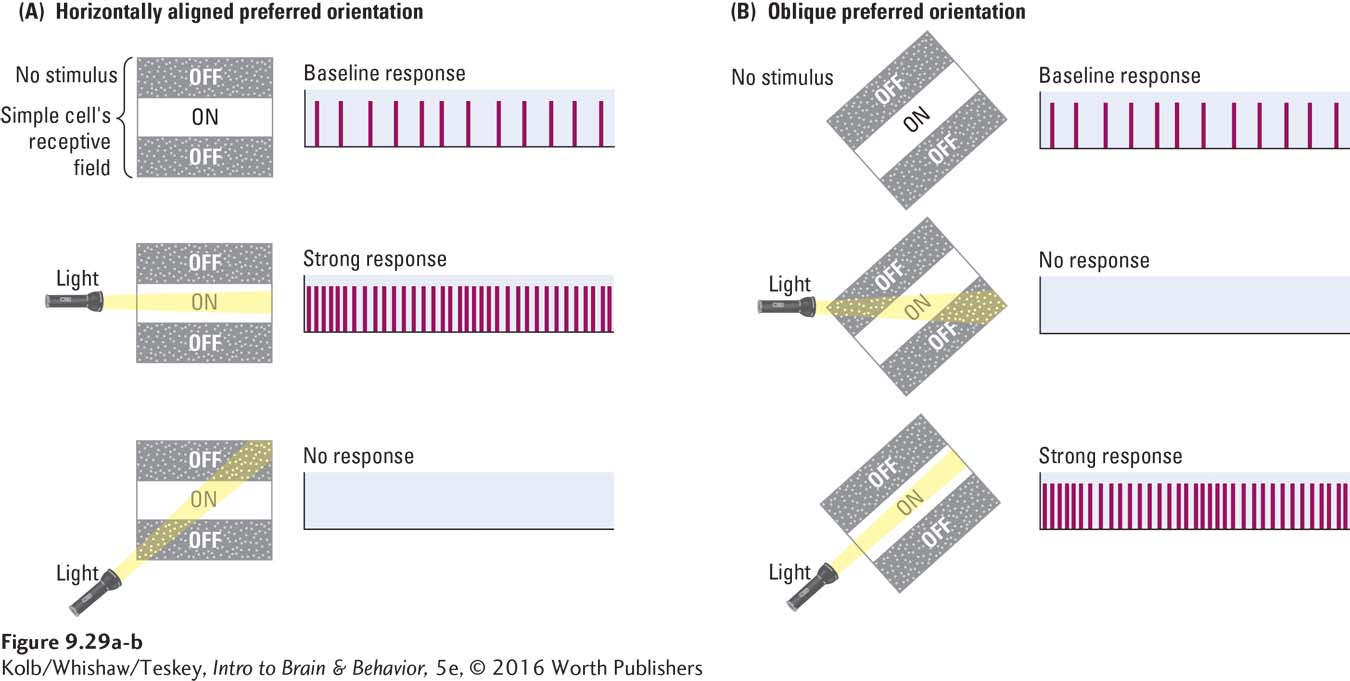
Now consider cells in region V1 that receive their visual inputs from LGN cells, which in turn receive theirs from retinal ganglion cells. As you read on, think about how these cortical cells are responding to the Clinical Focus 9-1 photograph. Because each V1 cell receives input from multiple RGCs, the receptive fields of the V1 neurons are much larger than those of retinal neurons. Consequently, V1 cells respond to stimuli more complex than simply light on or light off. In particular, these cells are maximally excited by bars of light oriented in a particular direction rather than by spots of light. These V1 cells are therefore called orientation detectors.
Like the ganglion cells, some orientation detectors have an on–
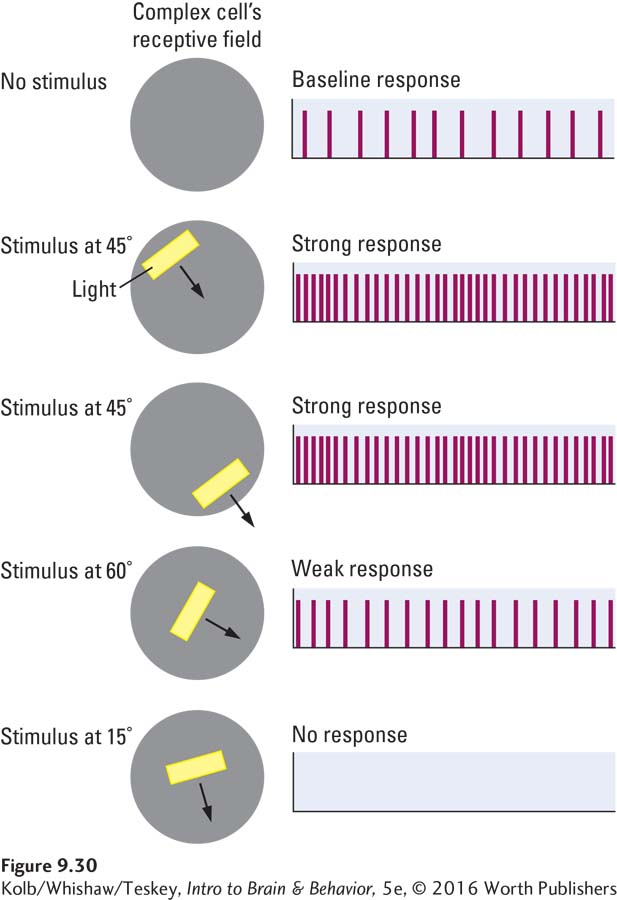
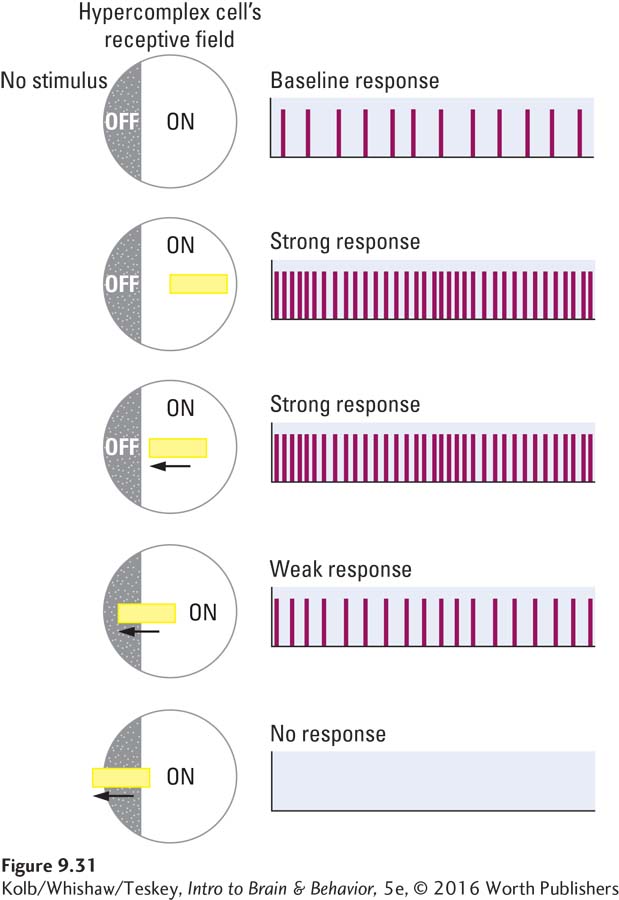
Simple cells are not the only kind of orientation detector in the primary visual cortex; several functionally distinct types of neurons populate region V1. For instance, the receptive fields of complex cells, such as those in Figure 9-30, are maximally excited by bars of light moving in a particular direction through the visual field. A hypercomplex cell, like a complex cell, is maximally responsive to moving bars but also has a strong inhibitory area at one end of its receptive field. As illustrated in Figure 9-31, a bar of light landing on the right side of the hypercomplex cell’s receptive field excites the cell; but if, for example, the bar lands mainly on the inhibitory area to the left, the cell’s firing is inhibited.
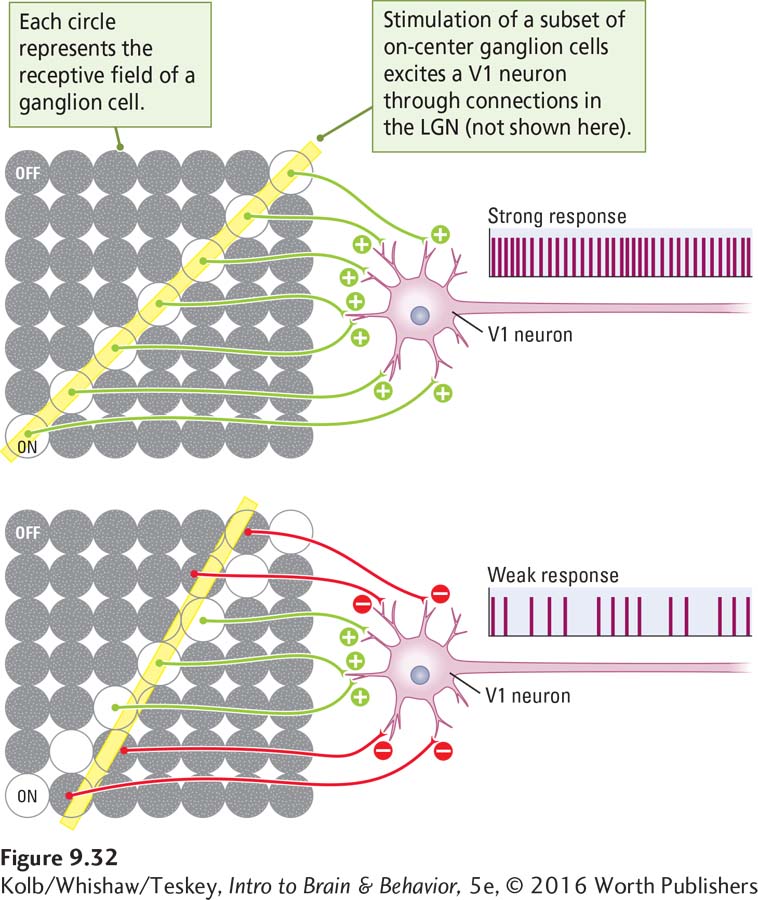
Each class of V1 neurons responds to bars of light in some way, yet this response results from input originating in retinal ganglion cells that respond maximally not to bars but to spots of light. How does this conversion from responding to spots to responding to bars take place? An example will help explain the process.
A thin bar of light falls on the retinal photoreceptors, striking the receptive fields of perhaps dozens of retinal ganglion cells. The input to a V1 neuron comes from a group of ganglion cells that happen to be aligned in a row, as in Figure 9-32. That V1 neuron is activated (or inhibited) only when a bar of light hitting the retina strikes that particular row of ganglion cells. If the bar of light shines at a slightly different angle, only some of the retinal ganglion cells in the row are activated, so the V1 neuron is excited only weakly.
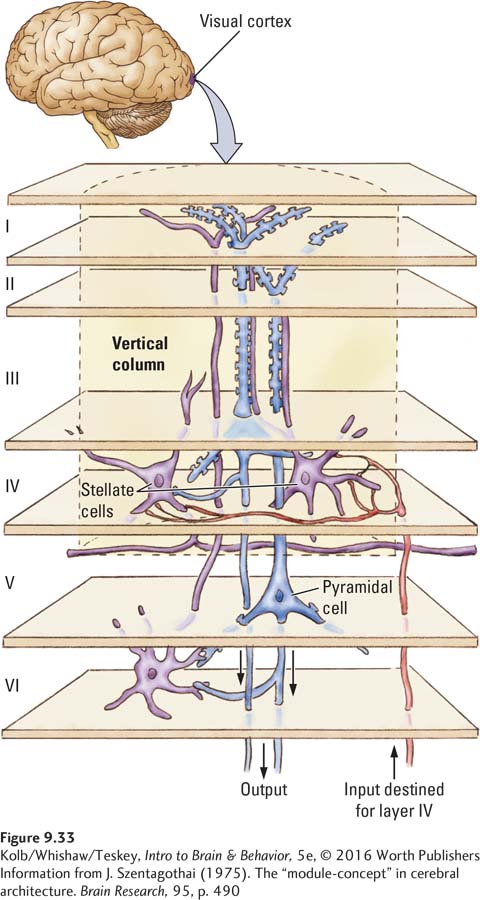
A characteristic of cortical structure is that the neurons are organized into functional columns. The connectivity pattern in a column is vertical: inputs arrive in layer IV, then connect with cells in the other layers. Figure 9-33 shows such a column, a 0.5-
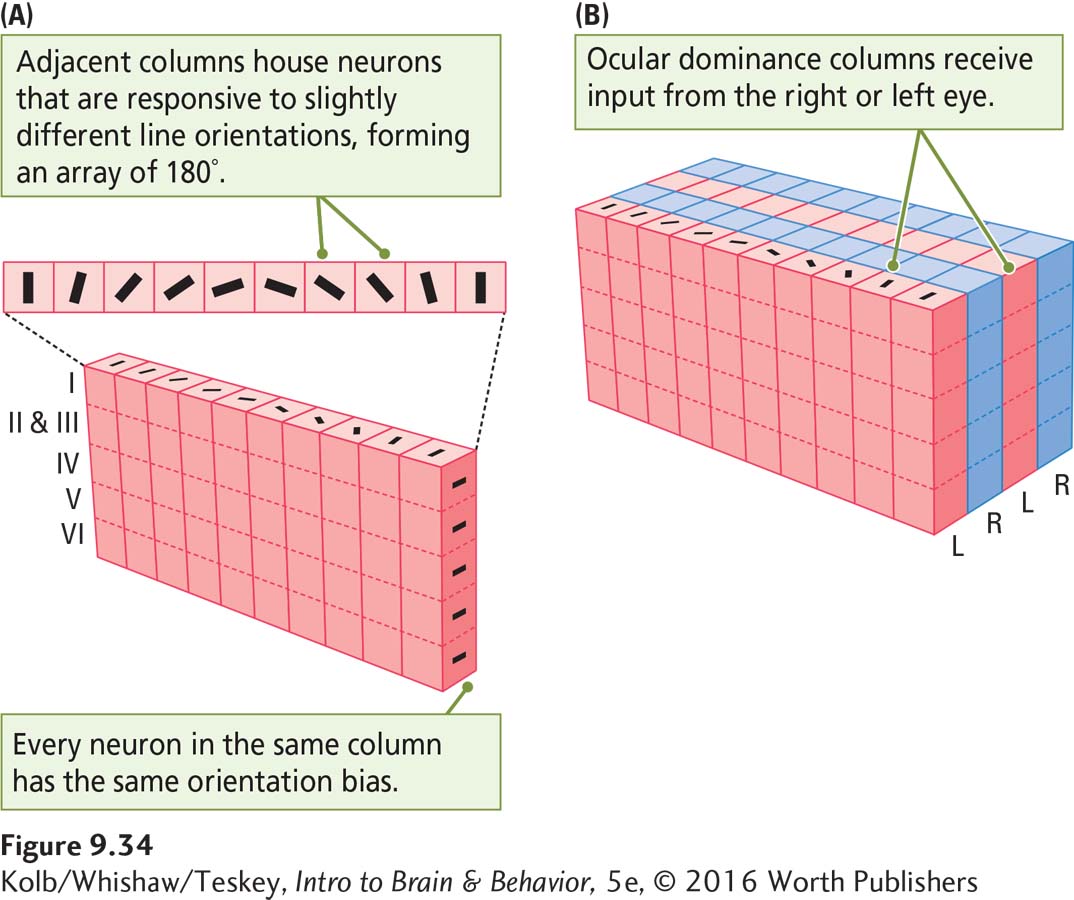
Neurons within a cortical column have similar functions. For example, Figure 9-34A shows that neurons within the same column respond to lines oriented in the same direction. Adjacent columns house cells responsive to different line orientations. Figure 9-34B shows the cortical columns of input coming from each eye, discussed earlier, called ocular dominance columns. So V1 has both orientation columns housing neurons of similar sensitivity and ocular dominance columns with input from one eye or the other.
Processing Shape in the Temporal Cortex
Consider neurons along the ventral stream in temporal lobe region TE. Rather than being responsive to spots or bars of light, TE neurons are maximally excited by complex visual stimuli, such as faces (see Figure 9-19A) or hands, and can be remarkably specific in their responsiveness. They may be responsive to particular faces seen head-
How far does this specialized responsiveness extend? Would it be practical to have visual neurons in the temporal cortex specialized to respond to every conceivable feature of objects? Keiji Tanaka (1993) approached this question by presenting monkeys with many three-
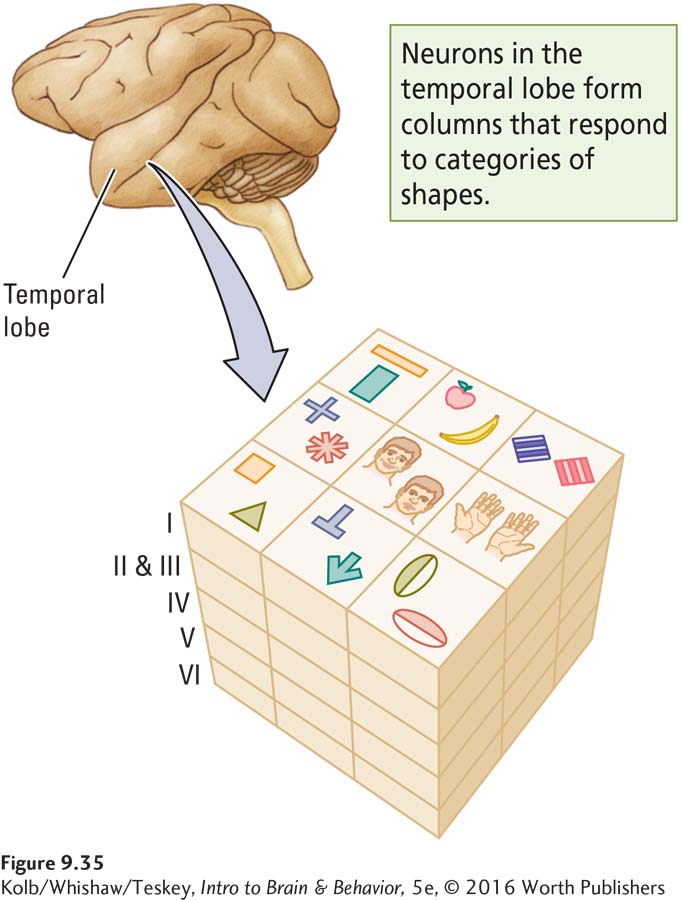
Having identified stimuli that were especially effective, such as faces or hands, he then wondered which specific features of those stimuli are critical to stimulating the neurons. Tanaka found that most neurons in area TE require rather complex features for their activation. These features include a combination of characteristics such as orientation, size, color, and texture. Furthermore, neurons with similar but not identical responsiveness to particular features tend to cluster in columns, as shown in Figure 9-35.
Apparently, then, an object is represented not by the activity of a single neuron but rather by the activity of many neurons with slightly varying stimulus specificity. These neurons are grouped in a column. This finding is important because it provides an explanation for stimulus equivalence, recognizing an object as remaining the same despite being viewed from different orientations.
Think of how the representation of objects by multiple neurons in a column can produce stimulus equivalence. If each neuron in the column module varies slightly in regard to the features to which it responds but the effective stimuli largely overlap, the effect of small changes in incoming visual images will be minimized and we will continue to perceive an object as itself.
The stimulus specificity of neurons in the inferior temporal cortex in monkeys shows remarkable neuroplasticity. If monkeys are trained to discriminate particular shapes to obtain a food reward, not only do they improve their discriminatory ability but neurons in the temporal lobe also modify their preferred stimuli to fire maximally to some of the stimuli used in training. This result shows that the temporal lobe’s role in visual processing is not determined genetically but is instead subject to experience, even in adults.
We can speculate that this neuroplastic characteristic evolved because it allows the visual system to adapt to a changing visual environment. Think of how different the demands on your visual recognition abilities are when you move from a dense forest to a treeless plain to a city street. The visual neurons of your temporal cortex can adapt to these differences (Tanaka, 1993). Experience-
The preferred stimuli of neurons in the primary visual cortex are not modified by experience. This implies that the stimulus preferences of V1 neurons are genetically programmed. Regardless, the functions of the V1 neurons underlie the more complex and flexible characteristics of the inferior temporal cortex neurons.
Seeing Color
Section 1-4 recounts several ideas on how the primate lifestyle, including diet, encouraged the evolution of complex nervous systems.
Scientists have long wondered why—
An explanation of color vision has its roots in the Renaissance 600 years ago in Italy. Painters of the time discovered that they could obtain the entire range of colors in the visual world by mixing only three colors of paint (red, blue, and yellow). This is the process of subtractive color mixing shown in Figure 9-36A.
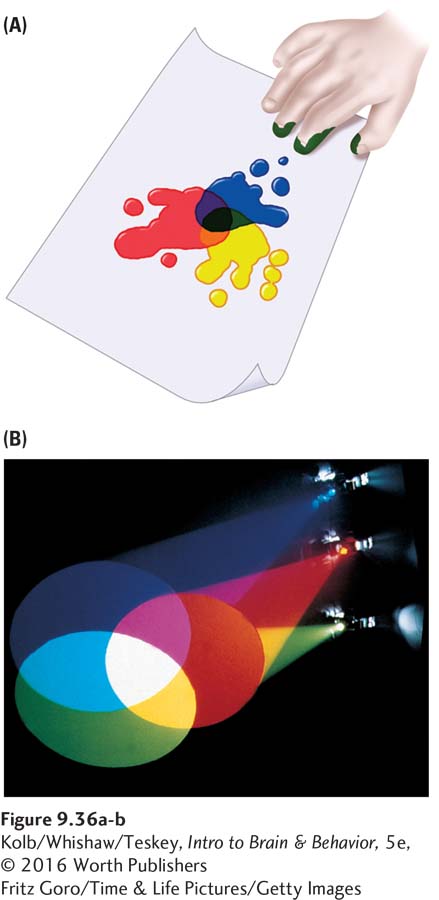
We now know that such trichromatic color mixing is a property of the cones in the retina. Subtractive color mixing works by removing light from the mix. This is why matte black surfaces reflect no light: the darker the color, the less light it contains.
Conversely, additive color mixing increases light to make color (Figure 9-36B). The lighter the color, the more light it contains, which is why a white surface reflects the entire visible spectrum. Unlike those of paint, the primary colors of light are red, blue, and green. Light of different wavelengths stimulates the three cone receptor types in different ways. It is the ratio of activity of these three receptor types that forms our impressions of colors.
Trichromatic Theory
According to the trichromatic theory, the color we see—
Trichromatic theory predicts that if we lack one cone receptor type, we cannot process as many colors as we could with all three. This is exactly what happens when a person is born with only two cone types. The colors this person cannot perceive depend on which receptor type is missing, as illustrated in Research Focus 9-3, Color-Deficient Vision.
9-3
Color-
Most people’s retinas contain three cone types. These people have trichromatic vision. But some people are missing one or more cone types and are thus often mistakenly said to be color-
To have no color vision at all, one would have to have only one type of photoreceptor, rods. This is a rare occurrence, but we do have a friend who has no concept of color. It has led to a lifetime of practical jokes, because others (especially his wife) must choose clothing colors that coordinate for him to wear.
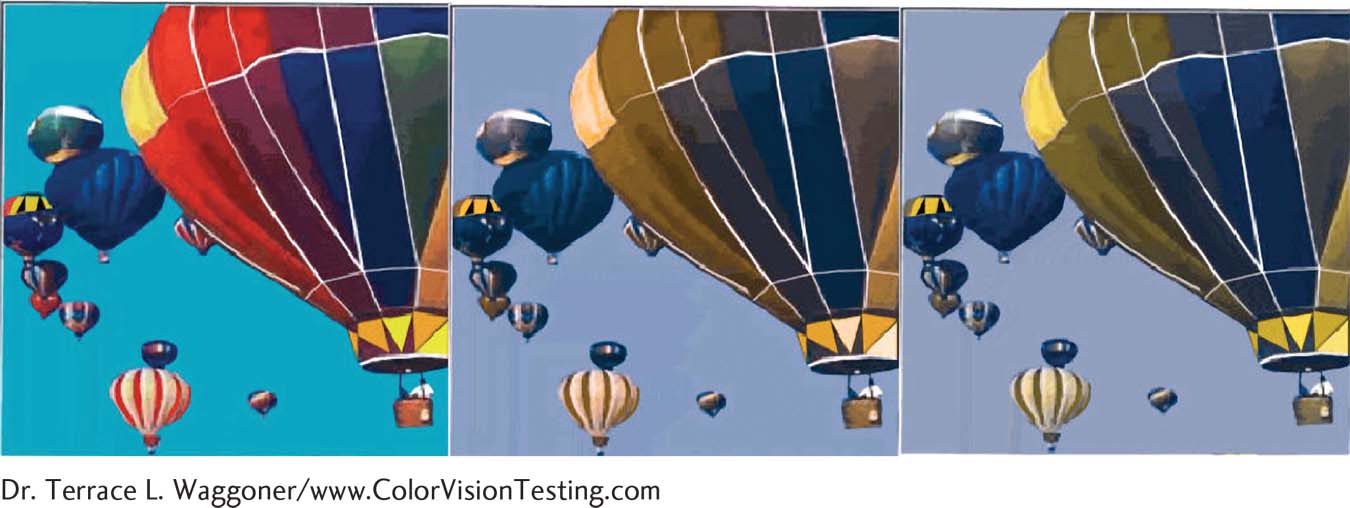
The complete lack of red cones leads to a condition called protanopia; the lack of green cones is deuteranopia; the lack of blue cones is tritanopia. The frequency of each condition is about 1 percent in men and 0.01 percent in women. Having only a partial lack of one cone type, most commonly the green cone, also is possible. This condition afflicts about 5 percent of men and 0.4 percent of women.
The illustration provides a simple approximation, compared with trichromats (left), of what people with protanopia (center) or deuteranopia (right) see. They still see plenty of color, but that color is largely different from the color trichromats see. Many domestic animals (dogs, cats, and horses among them) have deuteranopia, which actually gives them an advantage in seeing objects that appear camouflaged to trichromats. In fact, the military often use humans with deuteranopia to help see through camouflage.
The mere presence of cones in an animal’s retina does not mean that the animal has color vision. It simply means that the animal has photoreceptors particularly sensitive to light. Many animals lack color vision as we know it, but the only animal with eyes known to have no cones at all is a fish, the skate.
Opponent Processes
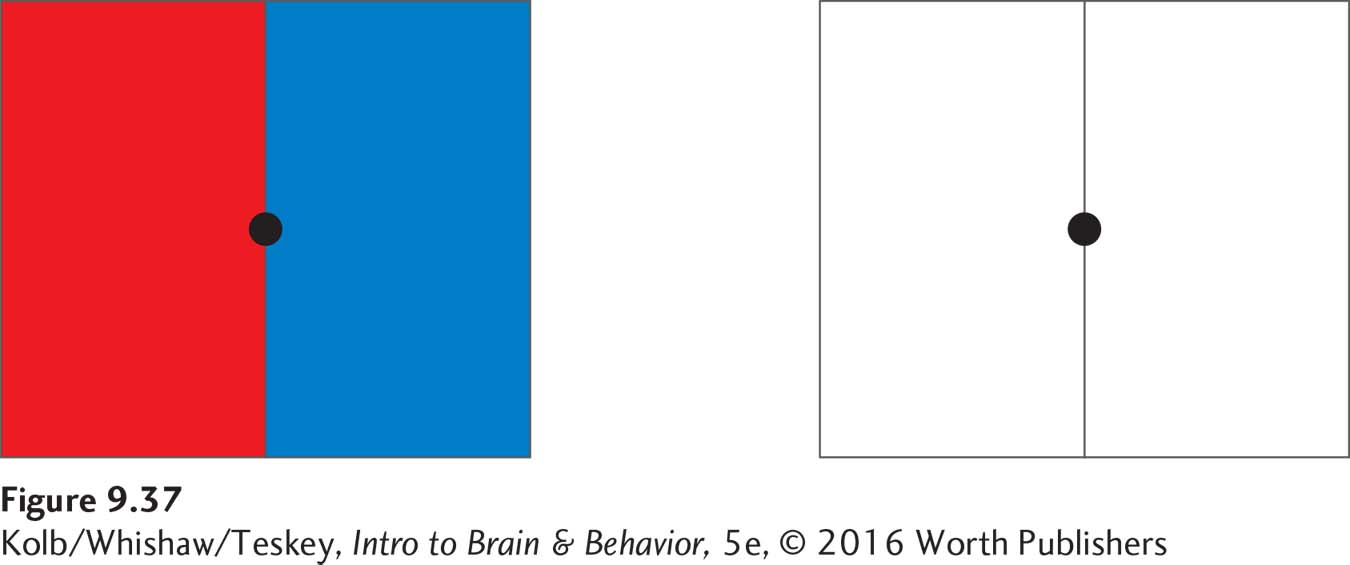
Although the beginning of color perception in the cones follows the trichromatic model, succeeding levels of color processing use a different strategy. Try staring first at the red and blue box in Figure 9-37 for about 30 seconds then at the white box next to it. When you shift your gaze to the white surface, you will see an afterimage in the colors opposite to red and blue—
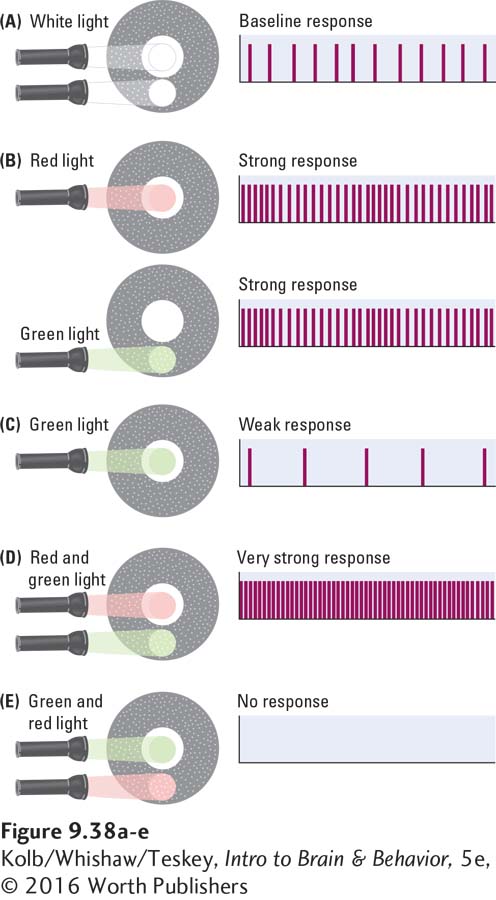
A characteristic of RGCs explains the two opposing pairs of four basic colors. Remember that RGCs have an on–
This arrangement can be adapted to produce color-
In fact, about 60 percent of human retinal ganglion cells are color-
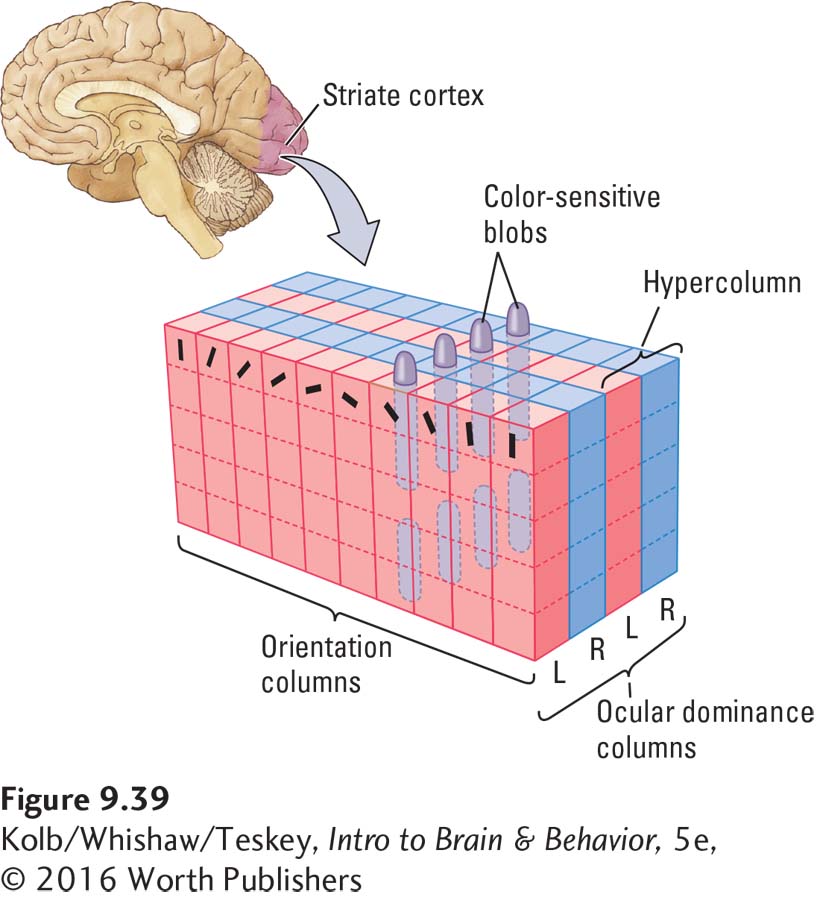
Cortical neurons in region V1 also respond to color in an opponent-
Figure 9-39 models how the color-
How do neurons in the visual system beyond V1 process color? You have already learned that cells in region V4 respond to color, but in contrast with the cells in region V1, these V4 cells do not respond to particular wavelengths. Rather, they are responsive to different perceived colors, with the center of the field being excited by a certain color and the surround being inhibited.
Speculation swirls about the function of these V4 cells. One idea is that they are important for color constancy, the property of perception whereby colors appear to remain the same relative to one another despite changes in light. For instance, were you to look at a bowl of fruit through light-
Neuronal Activity in the Dorsal Stream
A striking characteristic of many cells in the visual areas of parietal cortex is that they are virtually silent to visual stimulation when a person is under anesthesia. This is true of neurons in the posterior parietal regions of the dorsal stream. In contrast, cells in the visual temporal cortex do respond to visual stimulation when a person is anesthetized.
The silence on the part of neurons in the posterior parietal cortex under anesthesia makes sense if their role is to process visual information for action. In the absence of action when a person is unconscious, there is no need for processing. Hence, the cells are quiescent.
Cells in the dorsal stream are of many types, their details varying with the nature of the movement in which a particular cell takes part. One interesting cell category processes the visual appearance of an object to be grasped. If a monkey is going to pick up an apple, for instance, these cells respond even when the monkey is only looking at the apple. The cells do not respond when the monkey encounters the same apple if no movement is to be made.
These dorsal stream cells also respond if the monkey merely watches another monkey making movements to pick up the apple. Apparently, the cells have some understanding of what is happening in the external world. But that understanding is always related to action performed with respect to visually perceived objects. These cells led David Milner and Mel Goodale (2006) to conclude that the dorsal stream is a how visual system.
9-4 REVIEW
Neuronal Activity
Before you continue, check your understanding.
Question 1
Neurons in the primary visual cortex respond to properties of shapes, especially to ___________ oriented in a certain direction.
Question 2
Recognition of complex visual stimuli such as faces is completed in the ___________ lobe.
Question 3
The idea that the color we see is determined by the relative responses of the three cone types in the retina is called ___________.
Question 4
Retinal ganglion cells mediate color vision by ___________ processes.
Question 5
Describe the opponent process in the retinal ganglion cells.
Answers appear in the Self Test section of the book.
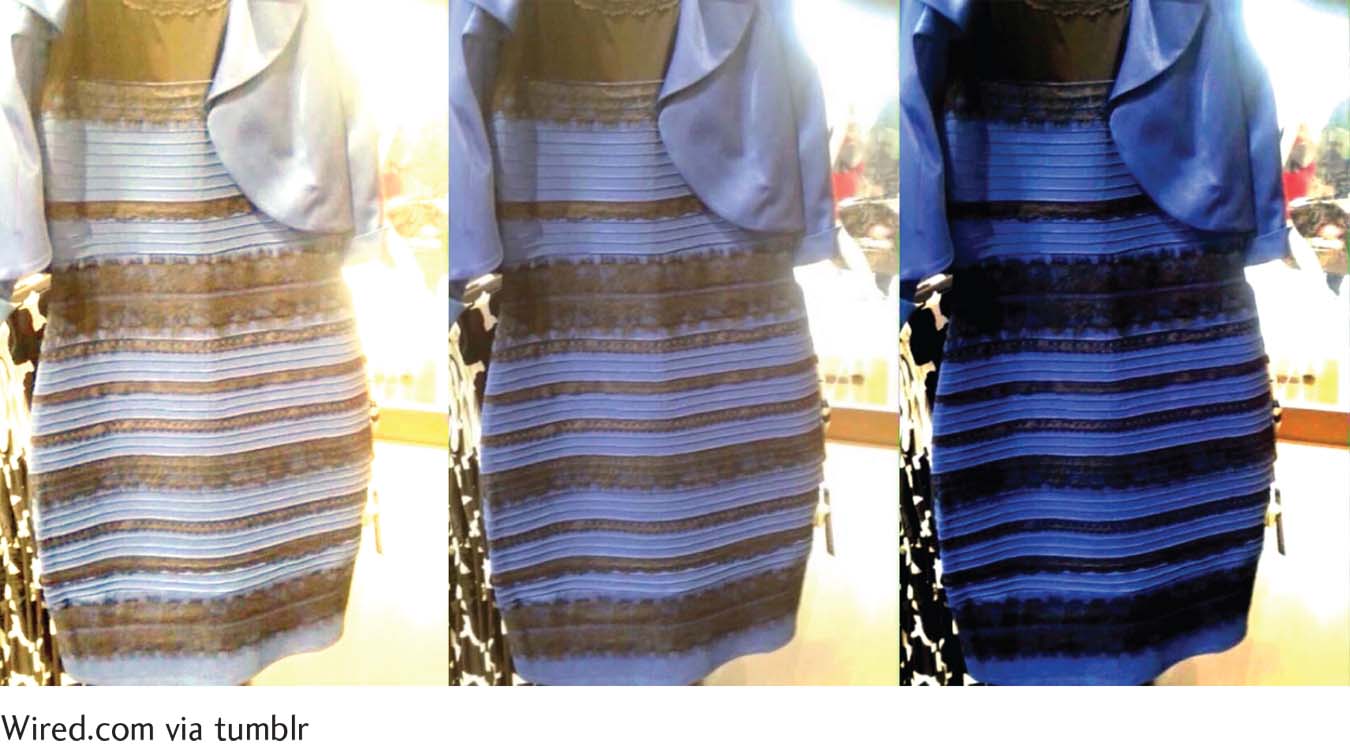
The blue and black dress at right is the original.