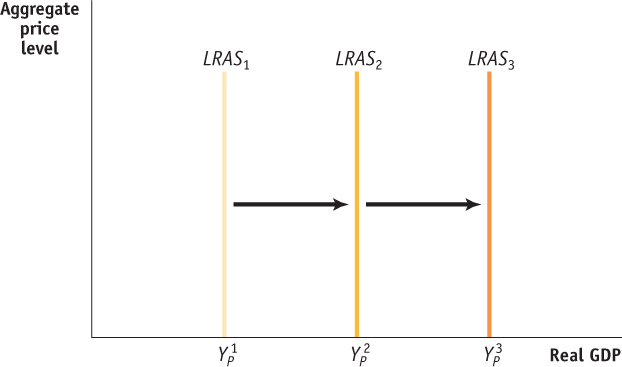
The aggregate demand and supply model we developed in Section 4 is another useful tool for understanding long-run economic growth. Recall that in the aggregate demand–aggregate supply model, the long-run aggregate supply curve shows the relationship between the aggregate price level and the quantity of aggregate output supplied when all prices, including nominal wages, are flexible. As shown in Figure 40.4, the long-run aggregate supply curve is vertical at the level of potential output. While actual real GDP is almost always above or below potential output, reflecting the current phase of the business cycle, potential output is the level of output around which actual aggregate output fluctuates. Potential output in the United States has risen steadily over time. This corresponds to a rightward shift of the long-run aggregate supply curve, as shown in Figure 40.5. Thus, the same government policies that promote an outward shift of the production possibilities curve promote a rightward shift of the long-run aggregate supply curve.
| Figure 40.4 | The Long-Run Aggregate Supply Curve |
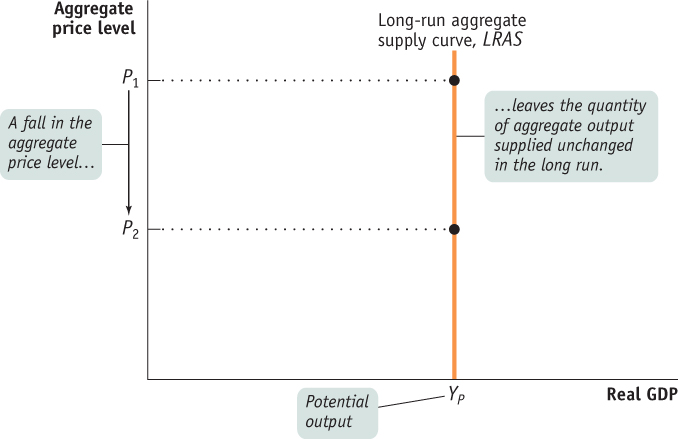
Figure 40.4: The Long-Run Aggregate Supply CurveThe long-run aggregate supply curve shows the quantity of aggregate output supplied when all prices, including nominal wages, are flexible. It is vertical at potential output, YP, because in the long run a change in the aggregate price level has no effect on the quantity of aggregate supplied.