Spending the Marginal Dollar
AP® Exam Tip
To determine whether a consumer should buy more of one good or another, compare the marginal utility per dollar received from each good, not just the marginal utility received from each good.
The marginal utility per dollar spent on a good or service is the additional utility from spending one more dollar on that good or service.
As we’ve just seen, we can find Sammy’s optimal consumption choice by finding the total utility he receives from each consumption bundle on his budget line and then choosing the bundle at which total utility is maximized. But we can use marginal analysis instead, turning Sammy’s problem of finding his optimal consumption choice into a “how much” problem. How do we do this? By thinking about choosing an optimal consumption bundle as a problem of how much to spend on each good. That is, to find the optimal consumption bundle with marginal analysis we ask the question of whether Sammy can make himself better off by spending a little bit more of his income on clams and less on potatoes, or by doing the opposite—
Our first step in applying marginal analysis is to ask if Sammy is made better off by spending an additional dollar on either good; and if so, by how much is he better off. To answer this question we must calculate the marginal utility per dollar spent on either clams or potatoes—
Marginal Utility per Dollar
We’ve already introduced the concept of marginal utility, the additional utility a consumer gets from consuming one more unit of a good or service; now let’s see how this concept can be used to derive the related measure of marginal utility per dollar.
AP® Exam Tip
You may need to construct and interpret a marginal utility table like Table 51.3 for the AP® exam. You may also be asked to determine how a change in price affects the quantity demanded for each good.
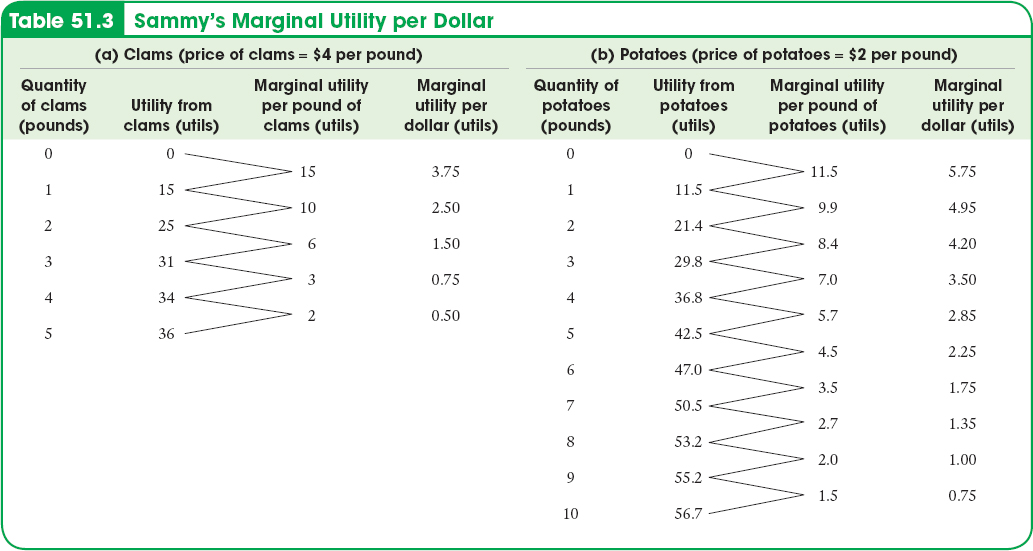
Table 51.3 shows how to calculate the marginal utility per dollar spent on clams and potatoes, respectively.

In panel (a) of the table, the first column shows different possible amounts of clam consumption. The second column shows the utility Sammy derives from each amount of clam consumption; the third column then shows the marginal utility, the increase in utility Sammy gets from consuming an additional pound of clams. Panel (b) provides the same information for potatoes. The next step is to derive marginal utility per dollar for each good. To do this, we just divide the marginal utility of the good by its price in dollars.
To see why we divide by the price, compare the third and fourth columns of panel (a). Consider what happens if Sammy increases his clam consumption from 2 pounds to 3 pounds. This raises his total utility by 6 utils. But he must spend $4 for that additional pound, so the increase in his utility per additional dollar spent on clams is 6 utils/$4 = 1.5 utils per dollar. Similarly, if he increases his clam consumption from 3 pounds to 4 pounds, his marginal utility is 3 utils but his marginal utility per dollar is 3 utils/$4 = 0.75 utils per dollar. Notice that because of diminishing marginal utility, Sammy’s marginal utility per pound of clams falls as the quantity of clams he consumes rises. As a result, his marginal utility per dollar spent on clams also falls as the quantity of clams he consumes rises.
So the last column of panel (a) shows how Sammy’s marginal utility per dollar spent on clams depends on the quantity of clams he consumes. Similarly, the last column of panel (b) shows how his marginal utility per dollar spent on potatoes depends on the quantity of potatoes he consumes. Again, marginal utility per dollar spent on each good declines as the quantity of that good consumed rises because of diminishing marginal utility.
We will use the symbols MUC and MUP to represent the marginal utility per pound of clams and potatoes, respectively. And we will use the symbols PC and PP to represent the price of clams (per pound) and the price of potatoes (per pound), respectively. Then the marginal utility per dollar spent on clams is MUC/PC and the marginal utility per dollar spent on potatoes is MUP/PP. In general, the additional utility generated from an additional dollar spent on a good is equal to:
(51-
Next we’ll see how this concept helps us determine a consumer’s optimal consumption bundle using marginal analysis.
Optimal Consumption
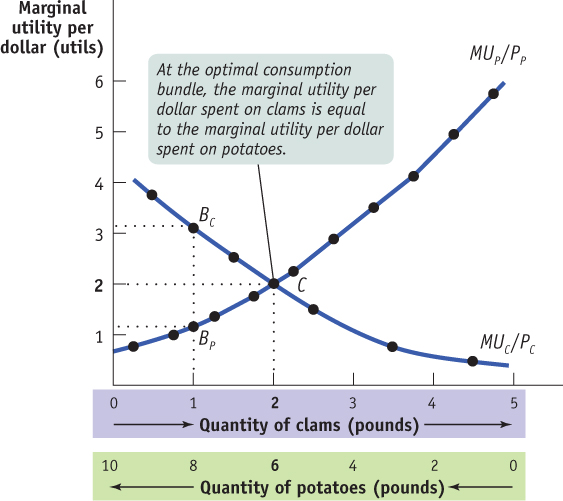
Let’s consider Figure 51.4. As in Figure 51.3, we can measure both the quantity of clams and the quantity of potatoes on the horizontal axis due to the budget constraint. Along the horizontal axis of Figure 51.4—also as in Figure 51.3—the quantity of clams increases as you move from left to right, and the quantity of potatoes increases as you move from right to left. The curve labeled MUC/PC in Figure 51.4 shows Sammy’s marginal utility per dollar spent on clams as derived in Table 51.3. Likewise, the curve labeled MUP/PP shows his marginal utility per dollar spent on potatoes. Notice that the two curves, MUC/PC and MUP/PP, cross at the optimal consumption bundle, point C, consisting of 2 pounds of clams and 6 pounds of potatoes. Moreover, Figure 51.4 illustrates an important feature of Sammy’s optimal consumption bundle: when Sammy consumes 2 pounds of clams and 6 pounds of potatoes, his marginal utility per dollar spent is the same, 2, for both goods. That is, at the optimal consumption bundle, MUC/PC = MUP/PP = 2.
| Figure 51.4 | Marginal Utility per Dollar |

This isn’t an accident. Consider another one of Sammy’s possible consumption bundles—
AP® Exam Tip
When the price of a good changes, the marginal utility per dollar spent on the good changes and so does the optimal consumption bundle.
The optimal consumption rule says that in order to maximize utility, a consumer must equate the marginal utility per dollar spent on each good and service in the consumption bundle.
How do we know this? If Sammy’s marginal utility per dollar spent on clams is higher than his marginal utility per dollar spent on potatoes, he has a simple way to make himself better off while staying within his budget: spend $1 less on potatoes and $1 more on clams. By spending an additional dollar on clams, he adds about 3 utils to his total utility; meanwhile, by spending $1 less on potatoes, he subtracts only about 1 util from his total utility. Because his marginal utility per dollar spent is higher for clams than for potatoes, reallocating his spending toward clams and away from potatoes would increase his total utility. On the other hand, if his marginal utility per dollar spent on potatoes is higher, he can increase his utility by spending less on clams and more on potatoes. So if Sammy has in fact chosen his optimal consumption bundle, his marginal utility per dollar spent on clams and potatoes must be equal.
This is a general principle, known as the optimal consumption rule: when a consumer maximizes utility in the face of a budget constraint, the marginal utility per dollar spent on each good or service in the consumption bundle is the same. That is, for any two goods C and P, the optimal consumption rule says that at the optimal consumption bundle

It’s easiest to understand this rule using examples in which the consumption bundle contains only two goods, but it applies no matter how many goods or services a consumer buys: the marginal utilities per dollar spent for each and every good or service in the optimal consumption bundle are equal.
The main reason for studying consumer behavior is to look behind the market demand curve. In Module 46 we explained how the substitution effect leads consumers to buy less of a good when its price increases. We used the substitution effect to explain, in general, why the individual demand curve obeys the law of demand. Marginal analysis adds clarity to the utility-