532

SECTION 10

Behind the Supply Curve: Profit, Production, and Costs
image
Rosemarie Gearhart/Getty Images

Module 52: Defining Profit

Module 53: Profit Maximization

Module 54: The Production Function

Module 55: Firm Costs

Module 56: Long-Run Costs and Economies of Scale

Module 57: Introduction to Market Structure

Economics by Example: “Could the Future Cost of Energy Change Life as We Know It?”

The Cost of Power

In Section 9 we examined the factors that affect consumer choice—the demand side of the supply and demand model. In this section we focus on the factors that affect producer choice and the supply side of the supply and demand model. Producers seek profit, which is the difference between total revenue and total cost. We turn to graphs to illustrate the story of what happens to various measures of revenue, cost, and profit as output changes. Different situations lead to different stories.

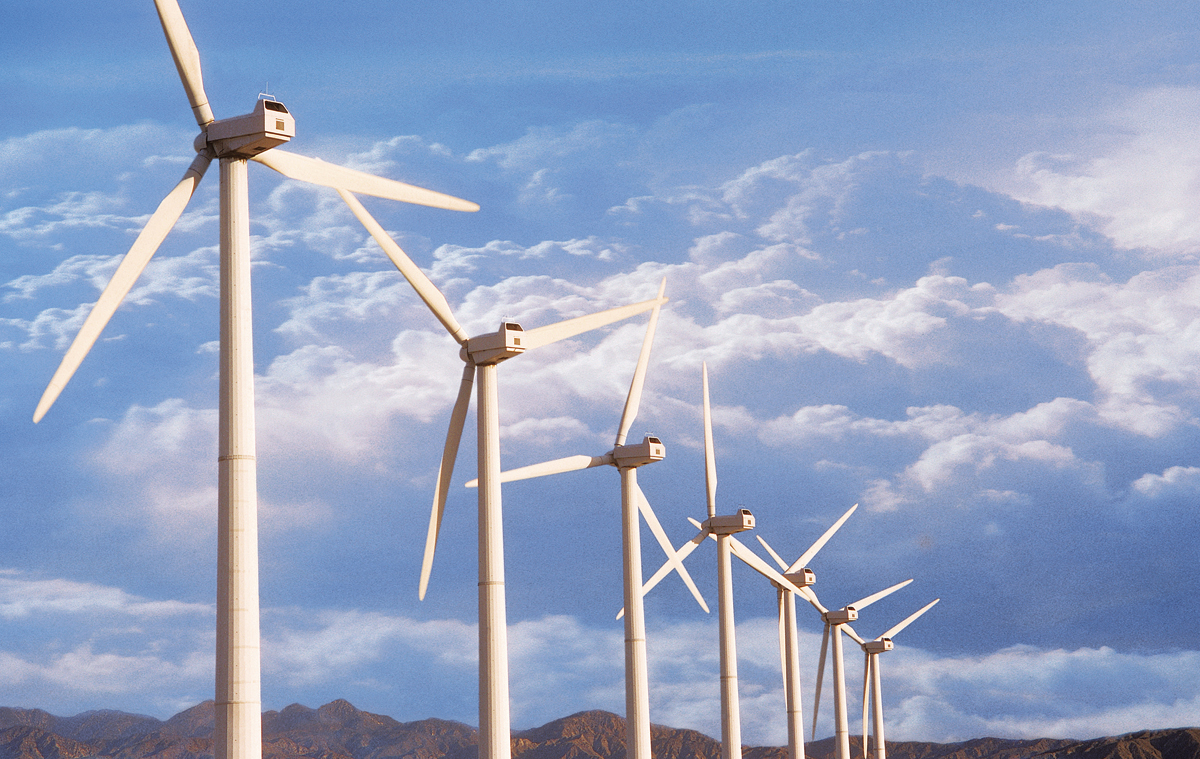
Consider the Spinning Spur Wind Project in Texas, which cost an estimated $322 million to build in 2012. The wind farm’s 70 turbines have the capacity to produce 161 megawatts of electricity at a negligible additional cost per kilowatt-hour, because the primary input—wind—is free.

The Current Creek natural gas–fired power plant in Utah cost an estimated $350 million to build in 2006, and has a capacity of 550 megawatts. The cost story at Current Creek differs from that at Spinning Spur because each kilowatt-hour of electricity produced at Current Creek requires the use of additional natural gas, which isn’t free. But the larger capacity at Current Creek allows the cost of constructing the plant to be spread across more units of output.

Given the complexity of cost and revenue stories, the need to visualize them with graphs is clear. In 2014, Google liked what it saw in the graphs for the Spinning Spur Wind Project enough to invest $200 million in the operation. In this section you will learn several analytical tools used to inform such decisions.

After a discussion of profit maximization, we will investigate the production function, which shows the relationship between the inputs used for production and the output that is produced. Then we’ll consider the costs that influence firms’ decisions about supply. The final module in this section introduces the models of market structure used to understand how the supply side of the economy works.