4.3 The Gains from Trade
Let’s return to the market in used textbooks, but now consider a much bigger market—
Similarly, we can line up outgoing students, who are potential sellers of the book, in order of their cost—
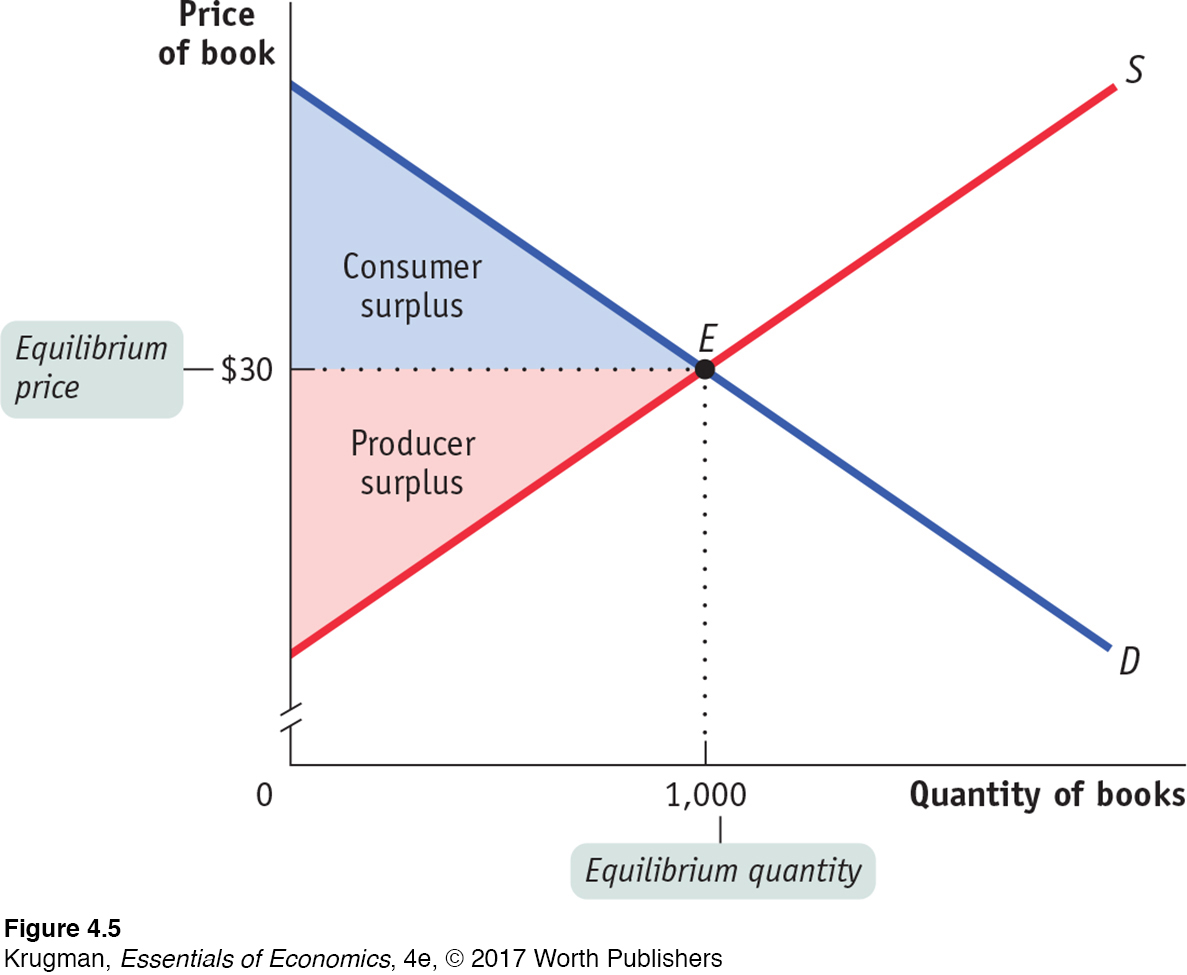
The total surplus generated in a market is the total net gain to consumers and producers from trading in the market. It is the sum of the consumer and the producer surplus.
As we have drawn the curves, the market reaches equilibrium at a price of $30 per book, and 1,000 books are bought and sold at that price. The two shaded triangles show the consumer surplus (blue) and the producer surplus (red) generated by this market. The sum of consumer and producer surplus is known as the total surplus generated in a market.
ECONOMICS in Action
Take the Keys, Please
![]() | interactive activity
| interactive activity

“Airbnb was really born from a math problem,” said its co-
From that bout of desperation-
What’s motivating all this sharing? Well, it isn’t an outbreak of altruism—
Quick Review
The demand curve for a good is determined by each potential consumer’s willingness to pay.
A fall in the price of a good increases consumer surplus through two channels: a gain to consumers who would have bought at the original price and a gain to consumers who are persuaded to buy by the lower price. A rise in the price of a good reduces consumer surplus in a similar fashion.
The supply curve for a good is determined by the cost of each seller.
When the price of a good rises, producer surplus increases through two channels: the gains of those who would have supplied the good at the original price and the gains of those who are induced to supply the good by the higher price. A fall in the price of a good similarly leads to a fall in producer surplus.
Individual consumer surplus is the net gain to an individual consumer from buying a good.
The total consumer surplus in a given market is equal to the area under the market demand curve but above the price.
The difference between the price and cost is the seller’s individual producer surplus.
The total producer surplus is equal to the area above the market supply curve but below the price.
Total surplus measures the gains from trade in a market.
Check Your Understanding 4-1
Question 4.1
1. Two consumers, Casey and Josey, want cheese-
| Quantity of peppers | Casey’s willingness to pay | Josey’s willingness to pay | Cara’s cost | Jamie’s cost |
| 1st pepper | $0.90 | $0.80 | $0.10 | $0.30 |
| 2nd pepper | 0.70 | 0.60 | 0.10 | 0.50 |
| 3rd pepper | 0.50 | 0.40 | 0.40 | 0.70 |
| 4th pepper | 0.30 | 0.30 | 0.60 | 0.90 |
Use the table to construct a demand schedule and a supply schedule for prices of $0.00, $0.10, and so on, up to $0.90.
A consumer buys each pepper if the price is less than (or just equal to) the consumer’s willingness to pay for that pepper. The demand schedule is constructed by asking how many peppers will be demanded at any given price. A producer will continue to supply peppers as long as the price is greater than, or just equal to, the producer’s cost. The supply schedule is constructed by asking how many peppers will be supplied at any price. The following table illustrates the demand and supply schedules.
TablePrice of pepper Quantity of peppers demanded Quantity of peppers demanded by Casey Quantity of peppers demanded by Josey Quantity of peppers supplied Quantity of peppers supplied by Cara Quantity of peppers supplied by Jamie $0.90 1 1 0 8 4 4 0.80 2 1 1 7 4 3 0.70 3 2 1 7 4 3 0.60 4 2 2 6 4 2 0.50 5 3 2 5 3 2 0.40 6 3 3 4 3 1 0.30 8 4 4 3 2 1 0.20 8 4 4 2 2 0 0.10 8 4 4 2 2 0 0.00 8 4 4 0 0 0 Find the equilibrium price and quantity in the market for cheese-
stuffed jalapeno peppers. The quantity demanded equals the quantity supplied at a price of $0.50, the equilibrium price. At that price, a total quantity of five peppers will be bought and sold.
Find consumer, producer, and total surplus in equilibrium in this market.
Casey will buy three peppers and receive a consumer surplus of $0.40 on his first, $0.20 on his second, and $0.00 on his third pepper. Josey will buy two peppers and receive a consumer surplus of $0.30 on her first and $0.10 on her second pepper. Total consumer surplus is therefore $1.00. Cara will supply three peppers and receive a producer surplus of $0.40 on her first, $0.40 on her second, and $0.10 on her third pepper. Jamie will supply two peppers and receive a producer surplus of $0.20 on his first and $0.00 on his second pepper. Total producer surplus is $1.10. Total surplus in this market is therefore $1.00 + $1.10 = $2.10.
Question 4.2
2. Show how each of the following three actions reduces total surplus:
Having Josey consume one fewer pepper and Casey one more pepper than in the market equilibrium.
If Josey consumes one fewer pepper, she loses $0.60 (her willingness to pay for her second pepper); if Casey consumes one more pepper, he gains $0.30 (his willingness to pay for his fourth pepper). This results in an overall loss of consumer surplus of $0.60 − $0.30 = $0.30.
Having Cara produce one fewer pepper and Jamie one more pepper than in the market equilibrium.
Cara’s cost of the last pepper she supplied (the third pepper) is $0.40, and Jamie’s cost of producing one more (his third pepper) is $0.70. Total producer surplus therefore falls by $0.70 − $0.40 = $0.30.
Having Josey consume one fewer pepper and Cara produce one fewer pepper than in the market equilibrium.
Josey’s willingness to pay for her second pepper is $0.60; this is what she would lose if she were to consume one fewer pepper. Cara’s cost of producing her third pepper is $0.40; this is what she would save if she were to produce one fewer pepper. If we therefore reduced quantity by one pepper, we would lose $0.60 − $0.40 = $0.20 of total surplus.
Solutions appear at back of book.