1.4 39The Economics of the Welfare State
WHAT YOU WILL LEARN
 What the welfare state is and the rationale for it
 What defines poverty, what causes poverty, and the consequences of poverty
 How income inequality in America has changed over time
 How programs like Social Security, Medicare, and Medicaid affect poverty and income inequality
 Why there are political differences and debate over the size of the welfare state
Poverty, Inequality, and Public Policy
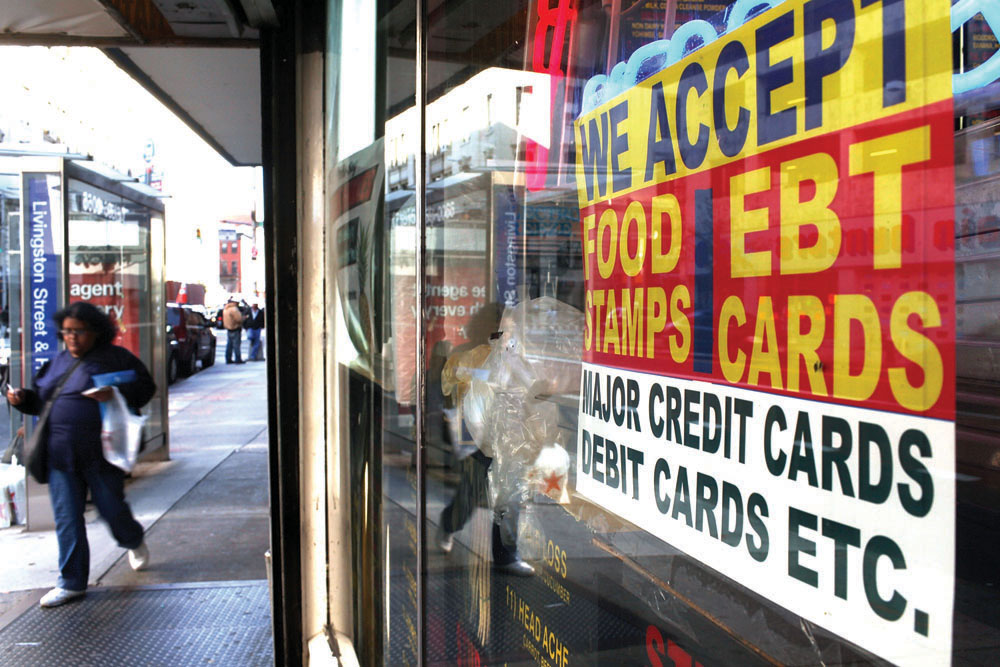
The welfare state is the collection of government programs designed to alleviate economic hardship.
A government transfer is a government payment to an individual or a family.
The term welfare state has come to refer to the collection of government programs that are designed to alleviate economic hardship. A large share of the government spending of all wealthy countries consists of government transfers—payments by the government to individuals and families—
In this module, we discuss the underlying rationale for welfare state programs. We’ll look at the the two main kinds of programs operating in the United States: income support programs, of which Social Security is by far the largest, and health care programs, dominated by Medicare and Medicaid. We conclude by evaluating the effectiveness of these programs.
The Logic of the Welfare State
There are three major economic rationales for the creation of the welfare state. We’ll turn now to a discussion of each.
1. Alleviating Income InequalitySuppose that the Taylor family, which has an income of only $15,000 a year, received a government check for $1,500. This check might allow the Taylors to afford a better place to live, eat a more nutritious diet, or in other ways significantly improve their quality of life. Also suppose that the Fisher family, which has an income of $300,000 a year, faced an extra tax of $1,500. This probably wouldn’t make much difference to their quality of life: at worst, they might have to give up a few minor luxuries.
A poverty program is a government program designed to aid the poor.
This example illustrates one rationale for the welfare state: alleviating income inequality. Because a marginal dollar is worth more to a poor person than a rich one, modest transfers from the rich to the poor will do the rich little harm but benefit the poor a lot. So, according to this argument, a government that plays Robin Hood, taking from the rich to give to the poor, does more good than harm. Programs that are designed to aid the poor are known as poverty programs.
2. Alleviating Economic InsecurityAnother rationale for the welfare state is alleviating economic insecurity. Imagine ten families, each of which expect an income next year of $50,000 if nothing goes wrong. But suppose the odds are that something will go wrong for one of the families, although nobody knows which one. For example, suppose each of the families has a one in ten chance of experiencing a sharp drop in income because a family member is laid off or incurs large medical bills. And assume that this produces severe hardship for the family.
A social insurance program is a government program designed to provide protection against unpredictable financial distress.
Now suppose there’s a government program that provides aid to families in distress, paying for that aid by taxing families that are having a good year. Arguably, this program will make all the families better off, because even families not currently receiving aid might need it at some point in the future. Each family will therefore feel safer knowing that the government stands ready to help when disaster strikes. Programs designed to provide protection against unpredictable financial distress are known as social insurance programs.
3. Reducing Poverty and Providing Access to Health CareThe final rationale for the welfare state involves the social benefits of poverty reduction and access to health care, especially when applied to children of poor households. Researchers have documented that such children, on average, suffer lifelong disadvantages. Even after adjusting for ability, children from disadvantaged backgrounds are more likely to be underemployed or unemployed, to engage in crime, and to suffer chronic health problems—
But while some political philosophers argue that principles of social justice demand that society take care of the poor and unlucky, others disagree, arguing that welfare state programs go beyond the proper role of government. To an important extent, the difference between those two positions defines what we mean in politics by “liberalism” and “conservatism.”
But before we get carried away, it’s important to realize that things aren’t so cut and dried. Even conservatives who believe in limited government typically support some welfare state programs. And even economists who support the goals of the welfare state are concerned about the effects of large-
The Problem of Poverty
The poverty threshold is the annual income below which a family is officially considered poor.
What, exactly, do we mean by poverty? Any definition is somewhat arbitrary. Since 1965, however, the U.S. government has maintained an official definition of the poverty threshold, a minimum annual income that is considered adequate to purchase the necessities of life. Families whose incomes fall below the poverty threshold are considered poor.
The official poverty threshold depends on the size and composition of a family. In 2012 the poverty threshold for an adult living alone was $11,945; for a household consisting of two adults and two children, it was $23,283.
Trends in PovertyContrary to popular misconceptions, although the official poverty threshold is adjusted each year to reflect changes in the cost of living, it has not been adjusted upward over time to reflect the long-
Somewhat surprisingly, however, this hasn’t happened. Figure 39-1 shows the U.S. poverty rate—the percentage of the population living below the poverty threshold—
FIGURE39-1Trends in the U.S. Poverty Rate, 1960–2011

The poverty rate is the percentage of the population with incomes below the poverty threshold.
Who are the Poor?Many Americans probably hold a stereotyped image of poverty: an African-
In 2011, about 43.2 million Americans were in poverty—
There is also a correlation between family makeup and poverty. Female-
What really stands out in the data, however, is the association between poverty and inadequate employment. Adults who work full time are very unlikely to be poor: only 2.8% of full-
Many industries, particularly in the retail and service sectors, now rely primarily on part-
What Causes Poverty?Poverty is often blamed on lack of education, and educational attainment clearly has a strong positive effect on income level—
Lack of proficiency in English is also a barrier to higher income. For example, Mexican-
And it’s important not to overlook the role of racial and gender discrimination; although less pervasive today than 50 years ago, discrimination still creates formidable barriers to advancement for many Americans. Non-
In addition, one important source of poverty that should not be overlooked is bad luck. Many families find themselves impoverished when a wage-
Consequences of PovertyThe consequences of poverty are often severe, particularly for children. In 2012, 22% of children in the United States lived in poverty. Poverty is often associated with a lack of access to health care, which can lead to further health problems that erode the ability to attend school and work later in life. Affordable housing is also frequently a problem, leading poor families to move often, disrupting school and work schedules. Recent medical studies have shown that children raised in severe poverty tend to suffer from lifelong learning disabilities. As a result, American children growing up in or near poverty don’t have an equal chance at the starting line: they tend to be at a disadvantage throughout their lives.
Table 39-1 shows the results of a long-
39-1
Percent of Eighth-
| Mathematics test score in bottom quartile | Mathematics test score in top quartile | |
|---|---|---|
| Parents in bottom quartile | 3% | 29% |
| Parents in top quartile | 30 | 74 |
| Source: National Center for Education Statistics, The Condition of Education 2003, p. 47. | ||
As you can see, the results were disturbing: only 29% of students who were in the highest-
Economic Inequality
The United States is a rich country. In 2007, before the recession hit, the average U.S. household had an income of $67,609, far exceeding the poverty threshold. Even after a devastating recession, average household income in 2012 was slightly higher at $69,677. How is it possible, then, that so many Americans still live in poverty? The answer is that income is unequally distributed, with many households earning much less than the average and others earning much more.
Table 39-2 shows the distribution of pre-
39-2
U.S. Income Distribution in 2011
| Income group | Income range | Average income | Percent of total income |
|---|---|---|---|
| Bottom quintile | Less than $20,262 | $11,239 | 3.2% |
| Second quintile | $20,262 to $38,520 | 29,204 | 8.4 |
| Third quintile | $38,520 to $62,434 | 49,842 | 14.3 |
| Fourth quintile | $62,434 to $101,582 | 80,080 | 23.0 |
| Top quintile | More than $101,582 | 178,020 | 51.1 |
| Top 5% | More than $186,000 | 311,444 | 22.3 |
| Mean income = $69,677 | Median income = $50,054 | ||
| Source: U.S. Census Bureau. | |||
For each group, Table 39-2 shows three numbers. The second column shows the income ranges that define the group. For example, in 2011, the bottom quintile consisted of households with annual incomes of less than $20,262, the next quintile of households had incomes between $20,262 and $38,520, and so on. The third column shows the average income in each group, ranging from $11,239 for the bottom fifth to $311,444 for the top 5%. The fourth column shows the percentage of total U.S. income received by each group.
Mean household income is the average income across all households.
Median household income is the income of the household lying at the exact middle of the income distribution.
Mean Versus Median Household IncomeAt the bottom of Table 39-2 are two useful numbers for thinking about the incomes of American households. Mean household income, also called average household income, is the total income of all U.S. households divided by the number of households. Median household income is the income of a household in the exact middle of the income distribution—
Economists often illustrate the difference by asking people first to imagine a room containing several dozen more or less ordinary wage-
This example helps explain why economists generally regard median income as a better guide to the economic status of typical American families than mean income: mean income is strongly affected by the incomes of a relatively small number of very-
What we learn from Table 39-2 is that income in the United States is quite unequally distributed. The average income of the poorest fifth of families is less than a quarter of the average income of families in the middle, and the richest fifth have an average income more than three times that of families in the middle. The incomes of the richest fifth of the population are, on average, about 15 times as high as those of the poorest fifth. In fact, the distribution of income in America has become more unequal since 1980, rising to a level that has made it a significant political issue.
The Gini coefficient is a number that summarizes a country’s level of income inequality based on how unequally income is distributed across quintiles.
The Gini CoefficientIt’s often convenient to have a single number that summarizes a country’s level of income inequality. The Gini coefficient, the most widely used measure of inequality, is based on how disparately income is distributed across the quintiles. A country with a perfectly equal distribution of income—
One way to get a sense of what Gini coefficients mean in practice is to look at international comparisons. Figure 39-2 shows the most recent estimates of the Gini coefficient for many of the world’s countries. Aside from a few countries in Africa, the highest levels of income inequality are found in Latin America, especially Colombia; countries with a high degree of inequality have Gini coefficients close to 0.6. The most equal distributions of income are in Europe, especially in Scandinavia; countries with very equal income distributions, such as Sweden, have Gini coefficients around 0.25. Compared to other wealthy countries, the United States, with a Gini coefficient of 0.41, has unusually high inequality, though it isn’t as unequal as in Latin America.
FIGURE39-2Income Inequality Around the World

How serious an issue is income inequality? In a direct sense, high income inequality means that some people don’t share in a nation’s overall prosperity. As we’ve seen, rising inequality explains how it’s possible that the U.S. poverty rate has failed to fall for the past 40 years even though the country as a whole has become considerably richer. Also, extreme inequality, as found in Latin America, is often associated with political instability because of tension between a wealthy minority and the rest of the population.
It’s important to realize, however, that the data shown in Table 39-2 overstate the true degree of inequality in America, for several reasons. One is that the data represent a snapshot for a single year, whereas the incomes of many individual families fluctuate over time. That is, many of those near the bottom in any given year are having an unusually bad year and many of those at the top are having an unusually good one. Over time, their incomes will revert to a more normal level. So a table showing average incomes within quintiles over a longer period, such as a decade, would not show as much inequality.
Furthermore, a family’s income tends to vary over its life cycle: most people earn considerably less in their early working years than they will later in life, then experience a considerable drop in income when they retire. Consequently, the numbers in Table 39-2, which combine young workers, mature workers, and retirees, show more inequality than would a table that compares families of similar ages.
Despite these qualifications, there is a considerable amount of genuine inequality in the United States. In fact, inequality not only persists for long periods of time for individuals, it extends across generations—
Economic Insecurity
As we stated earlier, although the rationale for the welfare state rests in part on the social benefits of reducing poverty and inequality, it also rests in part on the benefits of reducing economic insecurity, which afflicts even relatively well-off families.
One form economic insecurity takes is the risk of a sudden loss of income, which usually happens when a family member loses a job and either spends an extended period without work or is forced to take a new job that pays considerably less.
In a given year, according to recent estimates, about one in six American families will see their income cut in half from the previous year. Related estimates show that the percentage of people who find themselves below the poverty threshold for at least one year over the course of a decade is several times higher than the percentage of people below the poverty threshold in any given year.
Even if a family doesn’t face a loss in income, it can face a surge in expenses. The most common reasons for such surges are a medical problem that requires expensive treatment or the loss of a job.
LONG-TERM TRENDS IN INCOME INEQUALITY IN THE UNITED STATES
Does inequality tend to rise, fall, or stay the same over time? The answer is yes—all three. Over the course of the past century, the United States has gone through periods characterized by all three trends: an era of falling inequality during the 1930s and 1940s, an era of stable inequality for about 35 years after World War II, and an era of rising inequality over the past 30 years.
Detailed U.S. data on income by quintiles, as shown in Table 39-2, are only available starting in 1947. Panel (a) of Figure 39-3 shows the annual rate of growth of income, adjusted for inflation, for each quintile over two periods: from 1947 to 1980, and from 1980 to 2011. There’s a clear difference between the two periods. In the first period, income within each group grew at about the same rate—that is, there wasn’t much change in the inequality of income, just growing incomes across the board. After 1980, however, incomes grew much more quickly at the top than in the middle, and more quickly in the middle than near the bottom. So inequality has increased substantially since 1980. Overall, inflation-adjusted income for families in the top quintile rose 47% between 1980 and 2011, while almost holding constant for families in the bottom quintile.
FIGURE39-3Trends in U.S. Income Inequality

Although detailed data on income distribution aren’t available before 1947, economists have instead used other information like income tax data to estimate the share of income going to the top 10% of the population all the way back to 1917. Panel (b) of Figure 39-3 shows this measure from 1917 to 2011. These data, like the more detailed data available since 1947, show that American inequality was more or less stable between 1947 and the late 1970s but has risen substantially since. The longer-term data also show, however, that the relatively equal distribution of 1947 was something new. In the late nineteenth century, often referred to as the Gilded Age, American income was very unequally distributed. This high level of inequality persisted into the 1930s. But inequality declined sharply between the late 1930s and the end of World War II. In a famous paper, Claudia Goldin and Robert Margo, two economic historians, dubbed this narrowing of income inequality “the Great Compression.”
The Great Compression roughly coincided with World War II, a period during which the U.S. government imposed special controls on wages and prices. Evidence indicates that these controls were applied in ways that reduced inequality—for example, it was much easier for employers to get approval to increase the wages of their lowest-paid employees than to increase executive salaries. What remains puzzling is that the equality imposed by wartime controls lasted for decades after those controls were lifted in 1946.
Since the 1970s, as we’ve already seen, inequality has increased substantially. In fact, pre-tax income appears to be as unequally distributed in America today as it was in the 1920s, prompting many commentators to describe the current state of the nation as a new Gilded Age—albeit one in which the effects of inequality are moderated by taxes and the existence of the welfare state.

There is intense debate about the causes of this widening inequality. These are a few explanations economists offer for the dramatic rise in inequality:
- The most popular explanation is rapid technological change, which has increased the demand for highly skilled or talented workers more rapidly than the demand for other workers, leading to a rise in the wage gap between the highly skilled and other workers.
- Growing international trade may also have contributed by allowing the United States to import labor-intensive products from low-wage countries rather than making them domestically, reducing the demand for less skilled American workers and depressing their wages.
- Rising immigration may be yet another source. On average, immigrants have lower education levels than native-born workers and increase the supply of low-skilled labor while depressing low-skilled wages.
All these explanations, however, fail to account for one key feature: much of the rise in inequality doesn’t reflect a rising gap between highly educated workers and those with less education but rather growing differences among highly educated workers themselves. For example, schoolteachers and top business executives have similarly high levels of education, but executive paychecks have risen dramatically and teachers’ salaries have not. For some reason, a few superstars in the entertainment world, but also such groups as Wall Street traders and top corporate executives, now earn much higher incomes than was the case a generation ago. It’s still unclear what caused the change.
The U.S. Welfare State
The U.S. welfare state consists of three huge programs—
39-3
Major U.S. Welfare State Programs, 2011
| Monetary transfers | In- |
|
|---|---|---|
| Means- |
Temporary Assistance for Needy Families: $15 billion Supplemental Security Income: $50 billion Earned Income Tax Credit: $56 billion |
Supplemental Nutrition Assistance Program: $78 billion Medicaid: $275 billion |
| Not means- |
Social Security: $725 billion Unemployment insurance: $129 billion |
Medicare: $555 billion |
A means-
First, the table distinguishes between programs that are means-
An in-
Second, the table distinguishes between programs that provide monetary transfers that beneficiaries can spend as they choose and those that provide in-
Means-Tested Programs
When people use the term welfare, they’re often referring to monetary aid to poor families. The main source of such monetary aid in the United States is Temporary Assistance for Needy Families, or TANF. This program does not aid everyone who is poor; it is available only to poor families with children and only for a limited period of time.
TANF was introduced in the 1990s to replace a highly controversial program known as Aid to Families with Dependent Children, or AFDC. The older program was widely accused of creating perverse incentives for the poor, including encouraging family breakup. Partly as a result of the change in programs, the benefits of modern “welfare” are considerably less generous than those available a generation ago, once the data are adjusted for inflation. Also, TANF contains time limits, so welfare recipients—
Other means-
A negative income tax is a program that supplements the income of low-
Finally, economists use the term negative income tax for a program that supplements the earnings of low-
Social Security and Unemployment Insurance
Social Security, the largest program in the U.S. welfare state, is a non-
Social Security is supported by a dedicated tax on wages: the Social Security portion of the payroll tax pays for Social Security benefits. The benefits workers receive on retirement depend on their taxable earnings during their working years: the more you earn up to the maximum amount subject to Social Security taxes ($113,700 in 2013), the more you receive in retirement. Benefits are not, however, strictly proportional to earnings. Instead, they’re determined by a formula that gives high earners more than low earners, but with a sliding scale that makes the program relatively more generous for low earners.
Because most senior citizens don’t receive pensions from their former employers, and most don’t own enough assets to live off the income from their assets, Social Security benefits are an enormously important source of income for them. Fully 60% of Americans 65 and older rely on Social Security for more than half their income, and 20% have no income at all except for Social Security.
Unemployment insurance, although a much smaller amount of government transfers than Social Security, is another key social insurance program. It provides workers who lose their jobs with about 35% of their previous salary until they find a new job or until 26 weeks have passed. This period is sometimes extended when the economy is in a slump. For example, in response to the severe recession of 2007–
Unemployment insurance is financed by a tax on employers. Like Social Security, unemployment insurance is not means-
The Effects of the Welfare State on Poverty and Inequality
Because the people who receive government transfers tend to be different from those who are taxed to pay for those transfers, the U.S. welfare state has the effect of redistributing income from some people to others.
Each year the Census Bureau estimates the effect of this redistribution in a report titled “The Effects of Government Taxes and Transfers on Income and Poverty.” The report calculates only the direct effects of taxes and transfers, without taking into account changes in behavior that the taxes and transfers might cause. For example, the report doesn’t try to estimate how many older Americans who are now retired would still be working if they weren’t receiving Social Security checks. As a result, the estimates are only a partial indicator of the true effects of the welfare state. Nonetheless, the results are striking.
Table 39-4 shows how taxes and government transfers affected the poverty threshold for the population as a whole and for different age groups in 2009. It shows two numbers for each group: the percentage of the group that would have had incomes below the poverty threshold if the government neither collected taxes nor made transfers, and the percentage that actually fell below the poverty threshold once taxes and transfers were taken into account. (For technical reasons, the second number is somewhat lower than the standard measure of the poverty rate.)
39-4
Effects of Taxes and Transfers on the Poverty Rate, 2009
| Group (by age) | Poverty rate without taxes and transfers | Poverty rate with taxes and transfers |
|---|---|---|
| All | 23.7% | 13.1% |
| Under 18 | 24.7 | 16.6 |
| 18 to 64 | 17.5 | 11.7 |
| 65 and over | 48.0 | 9.8 |
| Source: U.S. Census Bureau. | ||
Overall, the combined effect of taxes and transfers was to cut the U.S. poverty rate nearly in half. The elderly derived the greatest benefits from redistribution, which reduced their potential poverty rate of 48.0% to an actual poverty rate of 9.8%.
Table 39-5 shows the effects of taxes and transfers on the share of aggregate income going to each quintile of the income distribution in 2009. Like Table 39-4, it shows both what the distribution of income would have been if there were no taxes or government transfers and the actual distribution of income taking into account both taxes and transfers. The effect of government programs was to increase the share of income going to the poorest 80% of the population, especially the share going to the poorest 20%, while reducing the share of income going to the richest 20%.
39-5
Effects of Taxes and Transfers on Income Distribution, 2009
| Quintiles | Share of aggregate income without taxes and transfers | Share of aggregate income with taxes and transfers |
|---|---|---|
| Bottom quintile | 0.7% | 3.7% |
| Second quintile | 6.9 | 9.8 |
| Third quintile | 14.0 | 15.9 |
| Fourth quintile | 24.1 | 24.2 |
| Top quintile | 54.3 | 46.4 |
| Source: U.S. Census Bureau. | ||
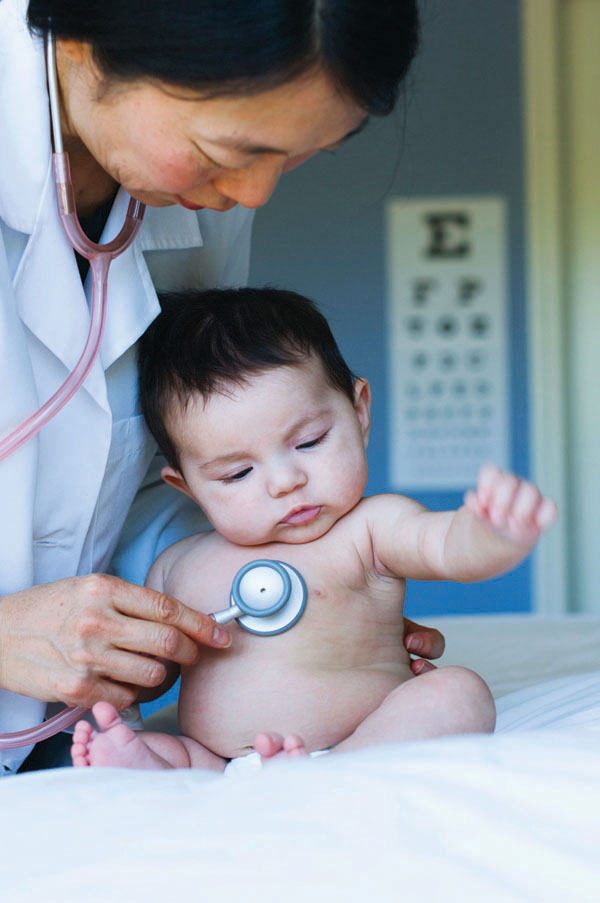
Health Care in the United States
A large part of the welfare state, in both the United States and other wealthy countries, is devoted to paying for health care. In most wealthy countries, the government pays between 70% and 80% of all medical costs. The private sector plays a larger role in the U.S. health care system. Yet even in America the government pays almost half of all health care costs; furthermore, it indirectly subsidizes private health insurance through the federal tax code.
Figure 39-4 shows who paid for U.S. health care in 2011. Only 12% of health care consumption spending (that is, all spending on health care except investment in health care buildings and facilities) was expenses “out of pocket”—that is, paid directly by individuals. Most health care spending, 73%, was paid for by some kind of insurance. Of this 73%, considerably less than half was private insurance; the rest was some kind of government insurance, mainly Medicare and Medicaid.
FIGURE39-4Who Paid for U.S. Health Care in 2011?

The Need for Health Insurance
In 2011, U.S. personal health care expenses were $7,326 per person—
Is it possible to predict who will have high medical costs? To a limited extent, yes: there are broad patterns to illness. For example, the elderly are more likely to need expensive surgery and/or drugs than the young. But the fact is that anyone can suddenly find himself or herself needing very expensive medical treatment, costing many thousands of dollars in a very short time—
Medicare and Medicaid
Table 39-6 shows the breakdown of health insurance coverage across the U.S. population in 2011. A majority of Americans, more than 170 million people, received health insurance through their employers. The majority of those who didn’t have private insurance were covered by two government programs, Medicare and Medicaid.
39-6
Number of Americans Covered by Health Insurance, 2011 (thousands)
| Covered by private health insurance | 197,323 |
|---|---|
| Employment- |
170,102 |
| Direct purchase | 30,244 |
| Covered by government | 99,497 |
| Medicaid | 50,835 |
| Medicare | 46,922 |
| Military health care | 13,712 |
| Not covered | 48,613 |
| Source: U.S. Census Bureau. | |
Medicare, financed by payroll taxes, is available to all Americans 65 and older, regardless of their income and wealth. It began in 1966 as a program to cover the cost of hospitalization but has since been expanded to cover a number of other medical expenses. At the beginning of 2006, there was a major expansion of Medicare to cover the cost of prescription drugs.

Unlike Medicare, Medicaid is a means-
The U.S. health care system, then, offers most Americans a mix of private insurance, mainly from employers, and public insurance of various forms. However, in 2011 almost 49 million people in America, 15.7% of the population, had no health insurance at all.
The Kaiser Family Foundation, an independent nonpartisan group that studies health care issues, offers this summary of who is uninsured in America: “The uninsured are largely low-
Because of the rising number of uninsured individuals and rising health care costs, there have been many calls for health care reform in the United States. And in 2010, Congress passed comprehensive health care reform legislation, officially known as the Patient Protection and Affordable Care Act (PPACA), or ACA for short. ACA, which takes full effect in 2014, is the largest expansion of the U.S. welfare state since the creation of Medicare and Medicaid in 1965. The two main goals of ACA are to cover the uninsured, especially adults who have been denied heath insurance because of preexisting medial conditions, and to help control rising health care costs in a variety of ways, including stricter oversight of reimbursements to medical providers.
The Debate over the Welfare State
The goals of the welfare state seem laudable: to help the poor, protect everyone from financial risk, and ensure that people can afford essential health care. But good intentions don’t always make for good policy.
There is an intense debate about how large the welfare state should be, a debate that partly reflects differences in philosophy but also reflects concern about the possibly counterproductive effects of incentives from welfare state programs. Disputes about the size of the welfare state are also one of the defining issues of modern American politics.
Problems with the Welfare State
There are two different lines of argument against the welfare state. One is based on philosophical concerns about the proper role of government. Some political theorists believe that redistributing income is not a legitimate role of government—
The more conventional argument against the welfare state involves the trade-
The trade-
But means-
This situation, in which earning more actually leaves a family worse off through lost benefits, is known as a notch. It is a well-
Most welfare state programs are designed to avoid creating a notch. This is typically done by setting a sliding scale for benefits such that they fall off gradually as the recipient’s income rises. As long as benefits are reduced by less than a dollar for every additional dollar earned, there is an incentive to work more if possible. However, current programs are not always successful in providing incentives for work.
The Politics of the Welfare State
In 1791, in the early phase of the French Revolution, France had a sort of congress, the National Assembly, in which representatives were seated according to social class: nobles, who pretty much liked the way things were, sat on the right; commoners, who wanted big changes, sat on the left. Ever since, it has been common in political discourse to talk about politicians as being on the “right” (more conservative) or on the “left” (more liberal).
But what do modern politicians on the left and right disagree about? In the modern United States, they mainly disagree about the appropriate size of the welfare state. The debate over the Affordable Care Act was a case in point, with the vote on the bill breaking down entirely according to party lines—
You might think that saying that political debate is really about just one thing—
The same studies that show a strong left–
Can economic analysis help resolve this political conflict? Only up to a point.
Some of the political controversy over the welfare state involves differences in opinion about the trade-
To an important extent, however, differences of opinion on the welfare state reflect differences in values and philosophy. And those are differences economics can’t resolve.
39
Solutions appear at the back of the book.
Check Your Understanding
1. Indicate whether each of the following programs is a poverty program or a social insurance program.
-
a. a pension guarantee program, which provides pensions for retirees if they have lost their employment-
based pension due to their employer’s bankruptcy A pension guarantee program is a social insurance program. The possibility of an employer declaring bankruptcy and defaulting on its obligation to pay employee pensions creates insecurity. By providing pension income to those employees, such a program alleviates this source of economic insecurity. -
b. the federal program known as SCHIP, which provides health care for children in families that are above the poverty threshold but still have relatively low income
The SCHIP program is a poverty program. By providing health care to children in low–income households, it targets its spending specifically to the poor. -
c. the Section 8 housing program, which provides housing subsidies for low-
income households The Section 8 housing program is a poverty program. By targeting its support to low–income households, it specifically helps the poor. -
d. the federal flood program, which provides financial help to communities hit by major floods
The federal flood program is a social insurance program. For many people, the majority of their wealth is tied up in the home they own. The potential for a loss of that wealth creates economic insecurity. By providing assistance to those hit by a major flood, the program alleviates this source of insecurity.
2. Recall that the poverty threshold is not adjusted to reflect changes in the standard of living. As a result, is the poverty threshold a relative or an absolute measure of poverty? That is, does it define poverty according to how poor someone is relative to others or according to some fixed measure that doesn’t change over time? Explain.
3. The accompanying table gives the distribution of income for a very small economy.
| Income | |
|---|---|
| Sephora | $39,000 |
| Kelly | 17,500 |
| Raul | 900,000 |
| Vijay | 15,000 |
| Oskar | 28,000 |
-
a. What is the mean income? What is the median income? Which measure is more representative of the income of the average person in the economy? Why?
To determine mean (or average) income, we take the total income of all individuals in this economy and divide it by the number of individuals. Mean income is ($39,000 + $17,500 + $900,000 + $15,000 + $28,000)/5 = $999,500/5 = $199,900. To determine median income, look at the accompanying table, which lines up the five individuals in order of their income.Income Vijay $15,000 Kelly 17,500 Oskar 28,000 Sephora 39,000 Raul 900,000
The median income is the income of the individual in the exact middle of the income distribution: Oskar, with an income of $28,000. So the median income is $28,000.
Median income is more representative of the income of individuals in this economy: almost everyone earns income between $15,000 and $39,000, close to the median income of $28,000. Only Raul is the exception: it is his income that raises the mean income to $199,900, which is not representative of most incomes in this economy. -
b. What income range defines the first quintile? The third quintile?
The first quintile is made up of the 20% (or one-fifth) of individuals with the lowest incomes in the economy. Vijay makes up the 20% of individuals with the lowest incomes. His income is $15,000, so that is the average income of the first quintile. Oskar makes up the 20% of individuals with the third − lowest incomes. His income is $28,000, so that is the average income of the third quintile.
4. Which of the following statements more accurately reflects the principal source of rising inequality in the United States today?
-
a. The salary of the manager of the local branch of Sunrise Bank has risen relative to the salary of the neighborhood gas station attendant.
-
b. The salary of the CEO of Sunrise Bank has risen relative to the salary of the local branch bank manager; these two individuals have similar education levels.
As the Economics in Action pointed out, much of the rise in inequality reflects growing differences among highly educated workers. That is, workers with similar levels of education earn very dissimilar incomes. As a result, the principal source of rising inequality in the United States today is reflected by statement b: the rise in the bank CEO’s salary relative to that of the branch manager.
5. Explain how the negative income tax avoids the disincentive to work that characterizes poverty programs that simply give benefits based on low income.
6. According to Table 39-4, what effect does the U.S. welfare state have on the overall poverty rate? On the poverty rate for those aged 65 and over?
7. Over the past 40 years, has the polarization in Congress increased, decreased, or stayed the same?
Multiple-
Question
1. Which of the following is true of the U.S. poverty rate?
| A. |
| B. |
| C. |
| D. |
| E. |
Question
2. In 2011, approximately what percentage of the U.S. population lived in poverty?
| A. |
| B. |
| C. |
| D. |
| E. |
Question
3. Average household income in the United States in 2012 was approximately
| A. |
| B. |
| C. |
| D. |
| E. |
Question
4. Programs designed to help only those with low incomes are called
| A. |
| B. |
| C. |
| D. |
| E. |
Question
5. If a country has a perfectly equal distribution of income, its Gini coefficient equals
| A. |
| B. |
| C. |
| D. |
| E. |
Critical-
In your opinion, what are the strongest arguments for and against government programs to redistribute income? To what extent can economics be used to resolve the debate?