The gut microbiome contributes to digestion
The gut is colonized by a huge population of microorganisms, mostly bacteria. Collectively the foreign species associated with an organism are called its microbiota, and their cumulative genomes are called the organism’s microbiome. The microbiomes of the skin are different from the microbiomes of the mouth, gut, respiratory tract, and urogenital tracts. The microbiota of the gut obtain their nutrition from the food passing through the gut while contributing to the host’s digestive processes. For example, members of the leech genus Hirudo produce no enzymes that can digest the proteins in the blood they suck from vertebrates; instead they depend on bacteria to perform this service. The resulting amino acids are subsequently used by both the leech and the bacteria. The microbiota of the human gut also provide important services in digestion, prevent the establishment of harmful microorganisms, and even produce some vitamins (vitamin K and biotin). It is estimated that the human body consists of 1013 cells, but our guts contain probably ten times that number of unicellular organisms representing at least 500 different species (see Figure 25.19). Recent studies have revealed that gut microbiomes are not constant, but are influenced by diet and other factors, including medications we ingest. The effects of different microbiomes may go far beyond simply facilitating digestion (Investigating Life: How Does the Gut Microbiome Contribute to Obesity and Metabolic Disease?).
investigating life
How Does the Gut Microbiome Contribute to Obesity and Metabolic Disease?
experiment
Original Paper: Caesar, R., V. Tremaroli, P. Kovatcheva-
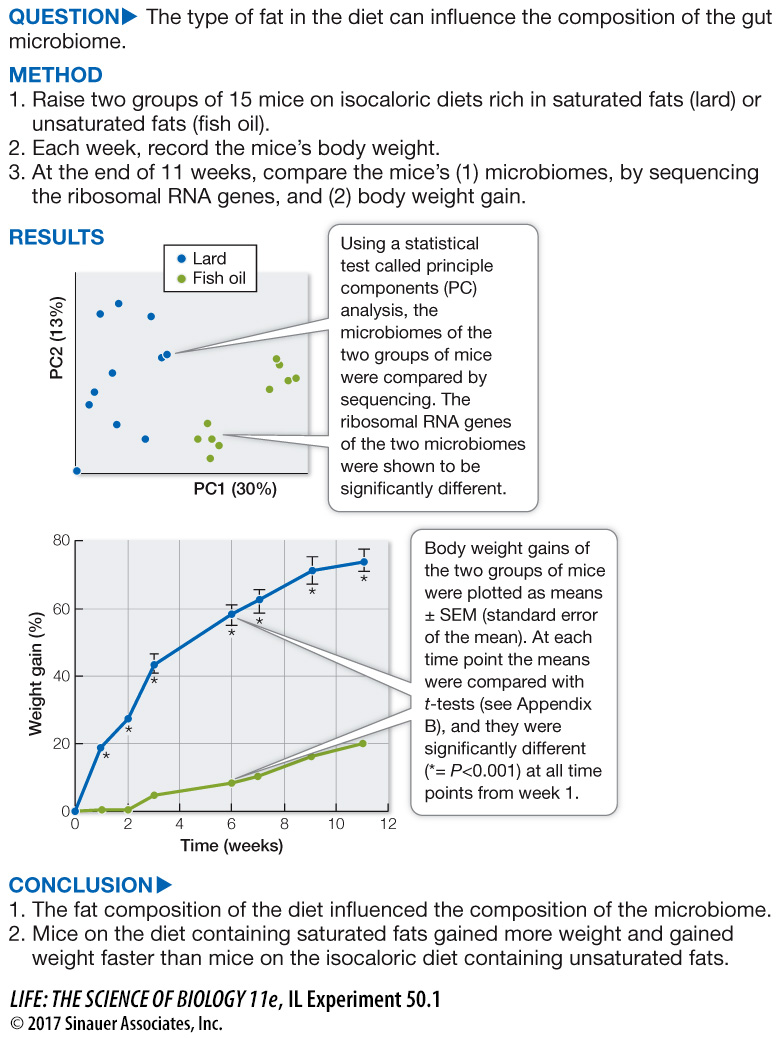
Fats differ in fatty acid composition, and fatty acids differ in the number of single or double bonds between their carbon atoms (see Key Concept 3.4). Saturated fatty acids have no double bonds, and unsaturated fatty acids do. Diets rich in saturated fatty acids are implicated in several health concerns, but what is it about saturated fatty acids that is unhealthy? Recent research examines the effect of diet on the gut microbiome, and in turn, the effect of the microbiome on health. Does the amount of saturated fat in the diet influence the composition of the microbiome, and does the microbiome influence the health consequences of a diet rich in saturated fats? We examine the first question in the experiment below, and the second question in an optional online companion exercise.
work with the data
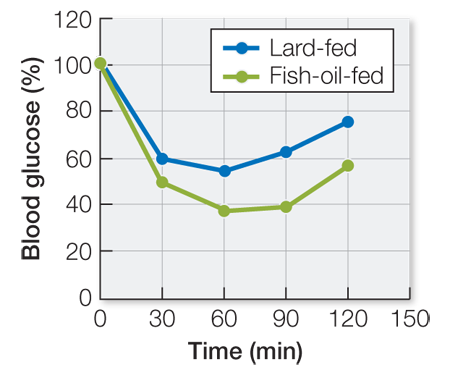
The researchers hypothesized that mice consuming more saturated fats will have a higher probability of becoming obese and developing symptoms of diabetes. To test for dietary effects on the development of metabolic disease, the researchers collected additional data from the two cohorts of mice: fasting blood glucose levels and fasting blood insulin levels. They also did an insulin tolerance test (effect of a dose of insulin on blood glucose level). Data are reported as means (±SEM).
QUESTIONS
1.
Using a t-test, determine whether the difference in the fasting blood glucose levels for the lard-
The average fasting blood glucose level was 11.00 mM for the lard-
2.
Using a t-test, determine whether the difference in the fasting blood insulin levels for the lard-
The average fasting blood insulin level was 3.96 ng/mL for the lard-
3.
Plot the glucose over time data. Did the two groups of mice differ in their response to the same dose of insulin? At which time points?
The time course of the response to an insulin challenge can be plotted. T-tests can then be used to see which points are significantly different.
The 30-
4.
What conclusions can you make about the effect of the type of dietary fat on carbohydrate metabolism?
The lard-
| Fasting blood glucose (mM) | Fasting blood insulin (ng/mL) | |||
|---|---|---|---|---|
| Lard (N = 14) | Fish oil (N = 14) | Lard (N = 10) | Fish oil (N = 14) | |
| 11 (0.22) | 10.32 (0.23) | 3.96 (0.36) | 1.09 (0.17) | |
| Blood glucose (% of the time 0 level) | ||
|---|---|---|
| Time after insulin injection (min) |
Lard | Fish oil |
| 0 | 100 | 100 |
| 30 | 59.8 (3.05) | 49.8 (4.09) |
| 60 | 54.5 (3.51) | 37.2 (4.07) |
| 90 | 63.1 (3.91) | 39.1 (4.09) |
| 120 | 75.6 (3.06) | 56.9 (3.31) |
A similar work with the data exercise may be assigned in LaunchPad.