All populations have the potential for exponential growth
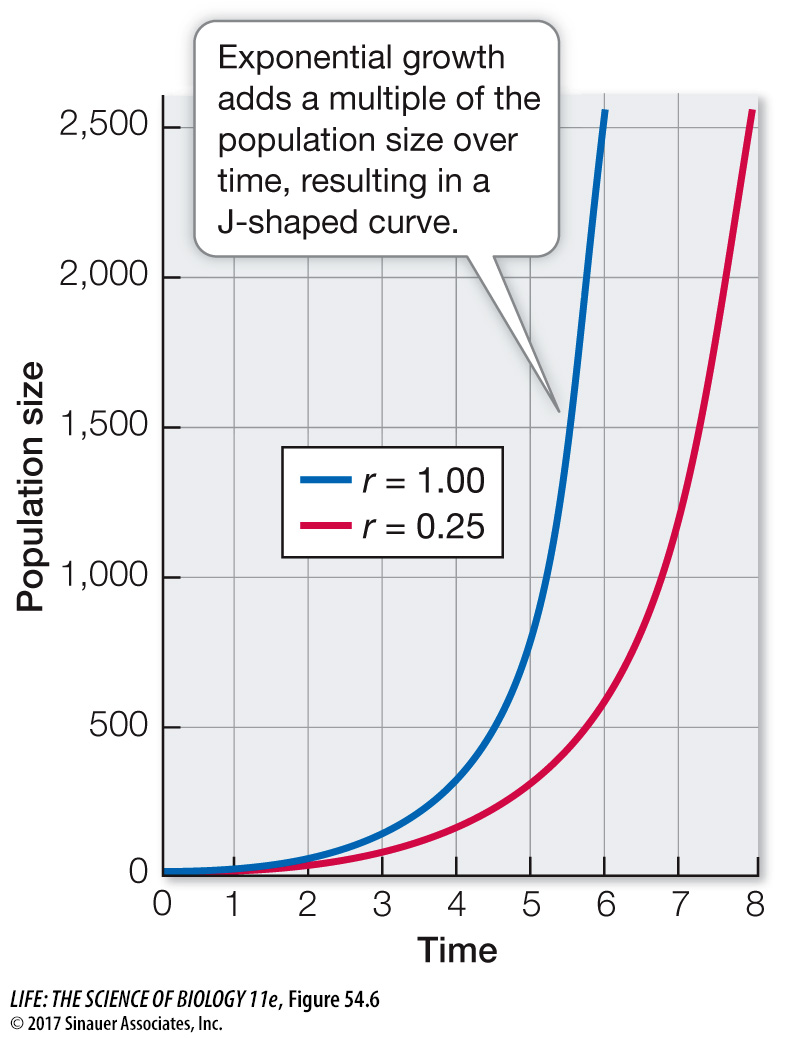
You know from Equation 54.4 that a population will grow, over some time period, as long as the per capita growth rate, r, is greater than zero (that is, when b > d). During this time period, the population will add a number of individuals that is r times its initial size. As the number of individuals in a population (N0) increases, the number of new individuals added per unit of time accelerates—

Q: Which curve, blue or red, has the faster population growth rate?
The blue curve (r = 1) has a faster growth rate, and thus a steeper slope, than the red curve (r = 0.25).
Activity 54.1 Exponential Population Growth Simulation
Equation 54.4 gives us the exponential growth of a population, but it does not allow us to predict the size of a population at a later time. Using calculus, we can integrate Equation 54.4 and get
Nt = N0ert (54.5)
where Nt = the population size at time t, N0 = the population size at time 0, e = a constant, the base of the natural log (e = 2.718), r = per capita growth rate, and t = the time interval between time 0 and time t. Knowing the starting population size and the per capita growth rate, we can use Equation 54.5 to forecast the population size at some later time, assuming exponential growth. This is similar to the equation banks use to calculate compound interest on a loan.
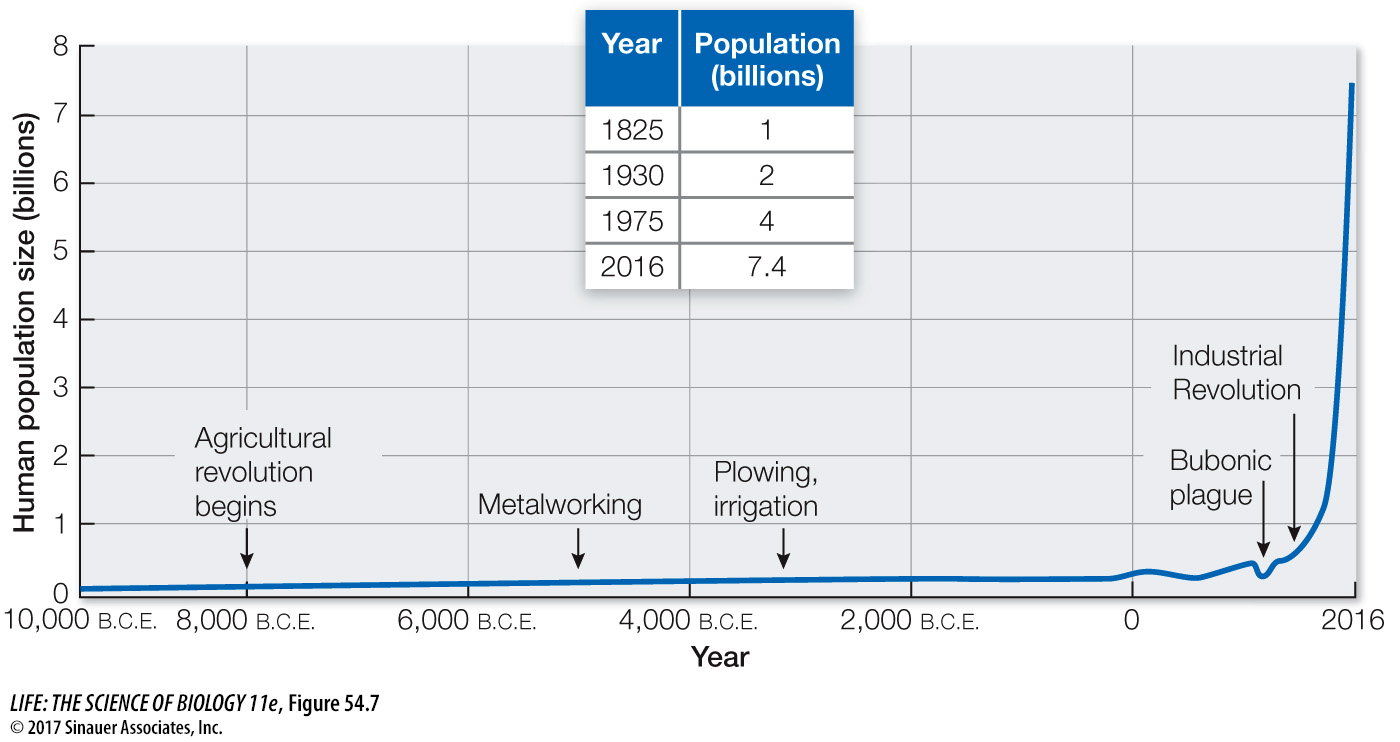
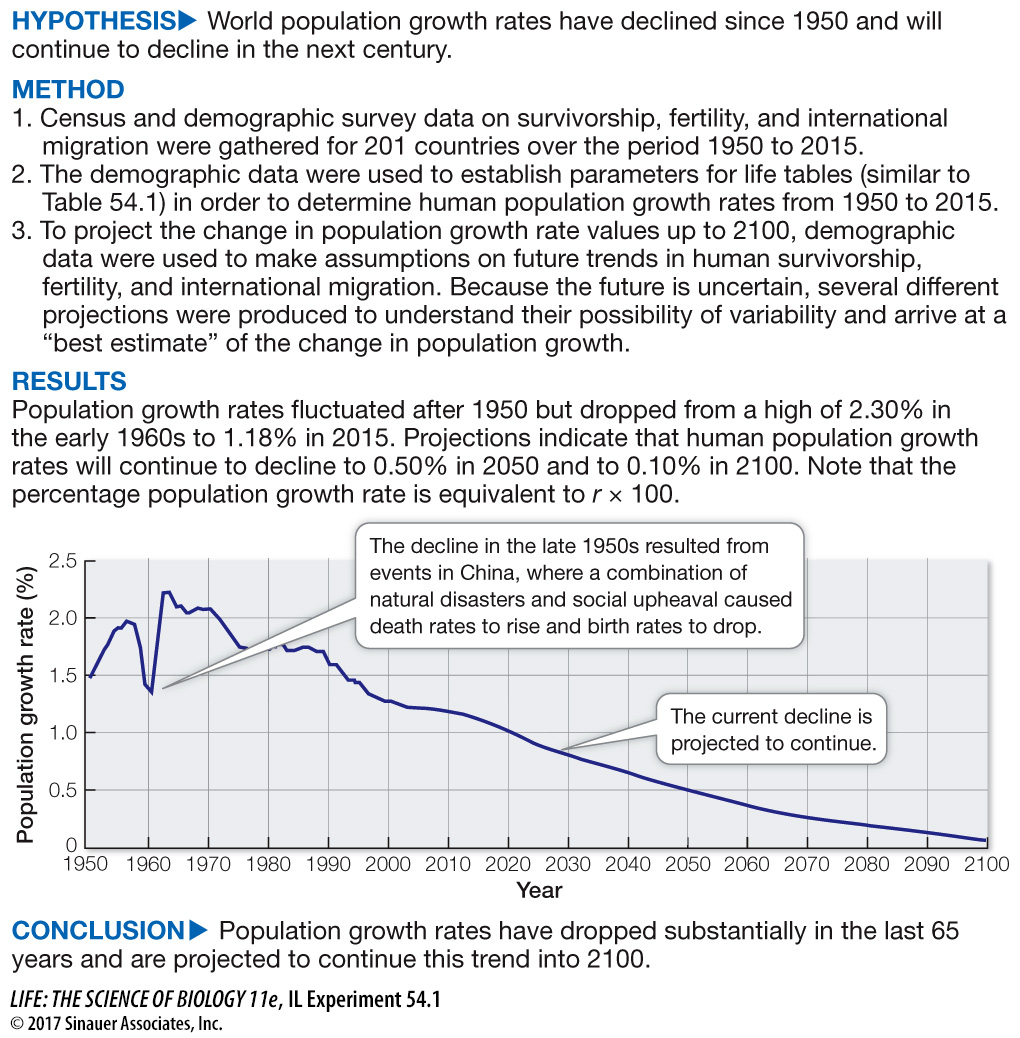
One application of projecting population sizes into the future comes in the form of predicting human population growth. The human population increased relatively slowly until 1825, when it was 1 billion, and now stands at 7.4 billion (Figure 54.7). United Nations data show that world population growth rates have fallen from a high of 2.30 percent (note that the percent population growth rate is r × 100) in the early 1960s to 1.18 percent today (Investigating Life: Will the Global Human Population Growth Rate Decline?). Projections indicate that human population growth rates will continue to decline to 0.50 percent in 2050 and to 0.10 percent in 2100, leading to a “best estimate” population size of 9.1 billion by 2050 and 11 billion by 2100. These projections in human population size beg the question: will world resources be able to sustain such large populations into the future? Is 11 billion above the maximum number of humans that can be supported sustainably on Earth? We will consider these questions at the end of the chapter.

investigating life
Will the Global Human Population Growth Rate Decline?
experiment
Original Paper: United Nations, Department of Economic and Social Affairs, Population Division. 2015. World Population Prospects: The 2015 Revision, Methodology of the United Nations Population Estimates and Projections, Working Paper No. ESA/P/WP.242.
Understanding the demographic changes in human populations over the coming years is critical in anticipating and planning for such challenges as food production, energy and water consumption, emerging diseases, and climate change facing our planet. The 2015 revision of World Population Prospects is the U.N.’s 24th round of official population estimates and projections. It builds on the previous reports by incorporating results from the most up-

work with the data
Here you will use the population growth rate from above to project the human population size on Earth in the future.
QUESTIONS
1.
Using Equation 54.5, the population size in 2015 (7.4 billion), and the population growth rate for 2015 (1.18%, above), estimate what the world’s population size would be in 2100.
Nt = (7.4 billion) e0.0118 × 85 = (7.4)(2.73) = 20.2 billion.
2.
Projections indicate that if the human population growth rate declines to 0.50% in 2050, the population size will be 9.1 billion by 2050 and 10 billion by 2080. Using the projected population size and growth rate in 2080, project the human population size in 2100.
Nt = (10 billion)e0.005 × 20 = (10)(1.01) = 10.1 billion.
3.
Suppose the carrying capacity of Earth is 12 billion people. Using Equation 54.7, project the human population size in 2100, given the 2015 data and 2080 data.
2015 data: Nt = 12 /[1 + ([12 - 7.4]/12)e-0.0118 × 85] = 12/1.14 = 10.5 billion.
2080 data: Nt = 12 /[1 + ([12 - 10]/12)e-0.005 × 20] = 12/1.15 = 10.4 billion.
4.
Given your calculations in Question 3, will Earth’s carrying capacity for humans be reached under either scenario by 2100? Which parameter (population growth rate or carrying capacity) is projected to most reduce population size by 2100?
Reducing the population growth rate will reduce the population size by 2100 slightly more than reducing the carrying capacity will. But either parameter would be important to reduce population size.
A similar work with the data exercise may be assigned in LaunchPad.
Some populations may grow at rates close to their maximum, depending on the circumstances. During the 39 years following the ban on commercial whaling, North Pacific humpback whale populations grew exponentially at a rate of 5–
We will turn next to what happens to population growth when limiting resources affect the number of births and deaths within a population.