key concept
57.3
Food Webs Transfer Energy and Nutrients from Primary Producers to Consumers
key concept
57.3
Food Webs Transfer Energy and Nutrients from Primary Producers to Consumers
You know from Chapter 56 that food webs can be constructed to represent the interactions and energy transfer that occur between different species and trophic levels. For example, the food web presented in Figure 56.3 shows the connections among primary producers and consumers in Yellowstone National Park. While the arrows indicate the trophic connections among species, they do not show how much energy is actually being transferred up the food web and converted into secondary production. We will now consider the factors important to secondary production.
focus your learning
Production efficiency varies based on whether the consumer is an ectotherm or an endotherm, and on the quantity and quality of food available.
Trophic efficiency varies among trophic levels and among ecosystems.
Omnivory and the number of trophic levels affect the transfer of energy through food webs.
Several factors may limit the number of trophic levels in a food web.
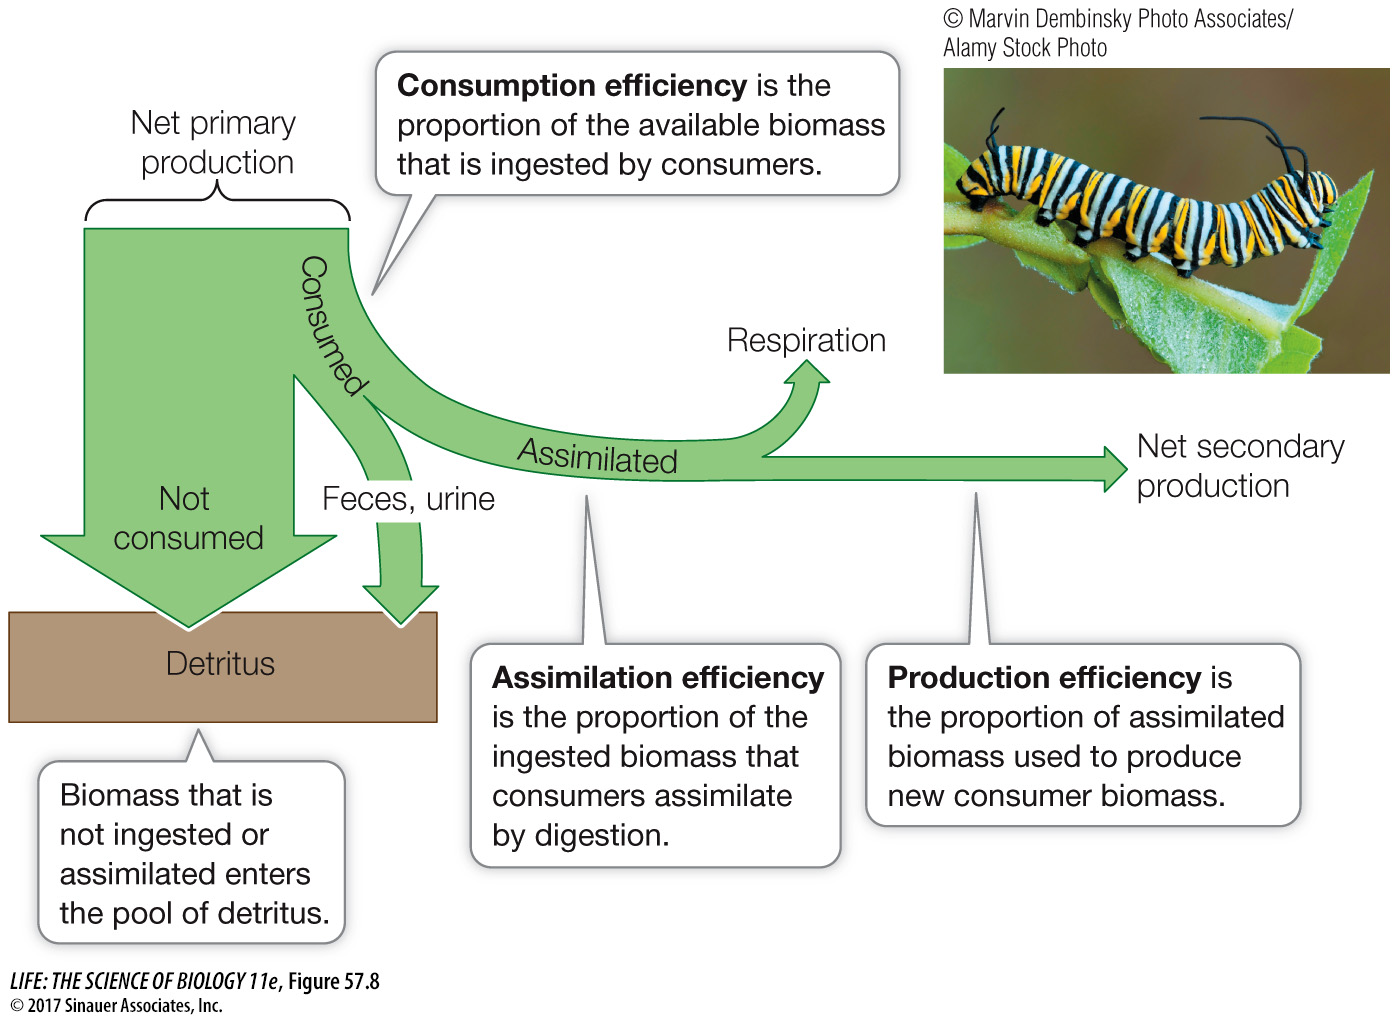
You know from Key Concept 8.1 that during energy transfer, some energy is lost as “unusable” to the system (second law of thermodynamics) and thus is unavailable to do work. For food webs, the consequence of this loss is that only part of the primary production consumed by heterotrophs is converted into heterotroph biomass. What factors are important to this movement and loss of energy from primary to secondary production? Net secondary production, or the amount of biomass obtained from the consumption of other organisms, depends on how much plant tissue is consumed (consumption efficiency), how much of the consumed food can actually be digested versus released as feces and urine (assimilation efficiency), and how much of the digested food is used in metabolic activities and released as CO2 through respiration versus stored as biomass (production efficiency) (Figure 57.8). We can think of production efficiency as the percentage of energy stored in assimilated food that is used to produce new biomass.
Q: Why do you think herbivores have lower production efficiencies than carnivores?
The consumption and assimilation efficiencies are lower for herbivores because primary producers have structural and chemical defenses that make them harder to consume and digest than animals.
Consumers can vary dramatically in production efficiency. For example, endotherms have much lower production efficiencies than ectotherms (Table 57.1). Because endotherms have to maintain high body temperatures, they have higher metabolic rates than ectotherms, and thus have less energy left over to devote to growth and reproduction. Moreover, endotherms vary in production efficiency depending on body size and metabolism. Larger mammals have lower metabolic rates and higher production efficiencies compared with smaller mammals and birds, whose greater surface area-
| Consumer group | Production efficiency (%) |
|---|---|
| Endotherms | |
| Birds | 1.3 |
| Small mammals | 1.5 |
| Large mammals | 3.1 |
| Ectotherms | |
| Fishes and social insects | 9.8 |
| Nonsocial insects | 40.7 |
| Herbivores | 38.8 |
| Detritivores | 47.0 |
| Carnivores | 55.6 |
| Non- |
25.0 |
| Herbivores | 20.9 |
| Detritivores | 36.2 |
| Carnivores | 27.6 |
|
Source: Data from Humphreys 1979. |
|
Because production efficiency affects the growth and reproduction of consumers, changes in the quality and quantity of food can lead to population declines. Research on Steller sea lions in the Gulf of Alaska and the Aleutian Islands offers a case in point. Sea lion populations declined by 85 percent over a 25-