Protein Conformation Is Determined by Sophisticated Physical Methods
In this chapter, we have emphasized that protein function is dependent on protein structure. Thus, to figure out exactly how a protein works, its three-dimensional structure must be determined. Determining a protein’s conformation requires sophisticated physical methods and complex analyses of the experimental data. Here we briefly describe three methods used to generate three-dimensional models of proteins.
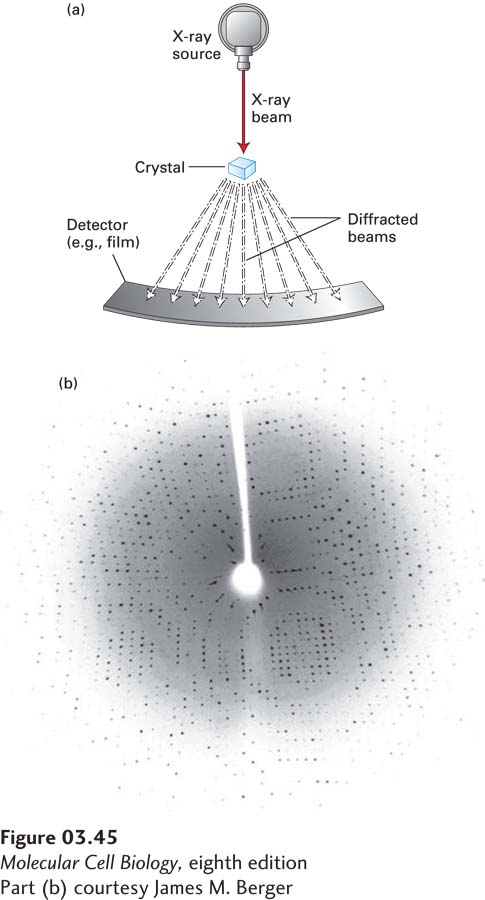
X-ray Crystallography The use of x-ray crystallography to determine the three-dimensional structures of proteins was pioneered by Max Perutz and John Kendrew in the 1950s. In this technique, beams of x-rays are passed through a protein crystal, in which millions of protein molecules are precisely aligned with one another in a rigid crystalline array. The wavelengths of x-rays are about 0.1–0.2 nm, short enough to determine the positions of individual atoms in the protein. The electrons in the atoms of the crystal scatter the x-rays, which produce a diffraction pattern of discrete spots when they are intercepted by photographic film or an electronic detector (Figure 3-45). Such patterns are extremely complex—composed of as many as 25,000 diffraction spots, or reflections, whose measured intensities vary depending on the distribution of the electrons in the sample, which is, in turn, determined by the atomic structure and three-dimensional conformation of the protein. Elaborate calculations and modifications of the protein (such as the binding of heavy metals) must be made to interpret the diffraction pattern and calculate the distribution of electrons (called the electron density map). A portion of an electron density map of a protein can be seen in Figure 2-9. With the three-dimensional electron density map in hand, one then “fits” a molecular model of the protein to match the electron density, and it is these models that one sees in the various diagrams of proteins throughout this book (e.g., Figure 3-9). The process is analogous to reconstructing the precise shape of a rock from the ripples that it creates when thrown into a pond. Although sometimes the structures of parts of the protein cannot be clearly defined, using x-ray crystallography, researchers are systematically determining the structures of representative types of most proteins. To date, more than 90,000 detailed three-dimensional structures, including more than 35,000 distinct protein sequences, have been established using x-ray crystallography. These structures can be found in the Research Collaboratory for Structural Bioinformatics Protein Data Bank (http://www.rcsb.org/pdb/home/home.do), each with its own “PDB” entry.
[Part (b) courtesy James M. Berger]
EXPERIMENTAL FIGURE 3-45X-ray crystallography provides diffraction data from which the three-dimensional structure of a protein can be determined. (a) Basic components of an x-ray crystallographic determination. When a narrow beam of x-rays strikes a crystal, part of it passes straight through and the rest is scattered (diffracted) in various directions. The intensity of the diffracted waves, which form periodic arrangements of diffraction spots, is recorded on an x-ray film or with a solid-state electronic detector. (b) X-ray diffraction pattern for a protein crystal collected on a solid-state detector. From complex analyses of patterns of spots like this one, the locations of the atoms in a protein can be determined. See J. M. Berg, J. L. Tymoczko, G. J. Gatto, and L. Stryer, 2015, Biochemistry, 8th ed., Macmillan.
[Part (b) courtesy James M. Berger]
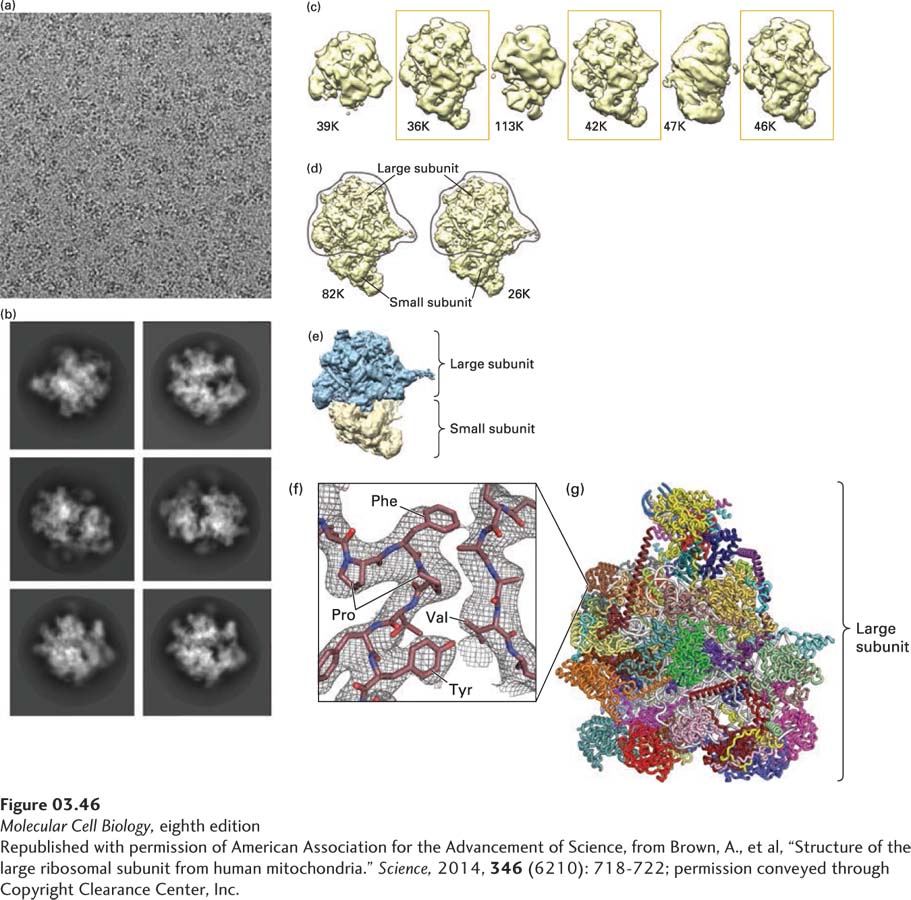
Cryoelectron Microscopy Although some proteins readily crystallize, obtaining crystals of others—particularly large multisubunit proteins and membrane-associated proteins—requires a time-consuming, often robot-assisted trial-and-error effort to find just the right conditions, if they can be found at all. (Growing crystals suitable for structural studies is as much an art as a science.) There are several ways to determine the structures of such difficult-to-crystallize proteins. One is cryoelectron microscopy (Figure 3-46). In this technique, a dilute protein sample in an aqueous solution is applied in a thin layer to an electron microscope sample holder (a “grid”) and rapidly frozen in liquid helium to preserve its structure. It is then examined in the frozen, hydrated state in a cryoelectron microscope. Images of the protein are recorded on a very sensitive camera using a low dose of electrons to prevent radiation-induced damage to the structure. Since the individual proteins are in different orientations in the frozen sample, sophisticated computer algorithms analyze the images to sort them into groups with the same orientation. The average image of each orientation is calculated from images of the thousands of different molecules in each group, and then the computer assembles the average images, each of which show views of the protein from different orientations, to reconstruct the protein’s structure in three dimensions. Recent advances in this technology have produced structures in which the polypeptide backbone and amino acid side chains can be discerned. These structures help provide insight into the mechanisms underlying the protein’s function. The use of cryoelectron microscopy and other types of electron microscopy for visualizing cell structures is discussed in Chapter 4.
Page 120
[Republished with permission of American Association for the Advancement of Science, from Brown, A., et al, “Structure of the large ribosomal subunit from human mitochondria.” Science, 2014, 346 (6210): 718-722; permission conveyed through Copyright Clearance Center, Inc.]
EXPERIMENTAL FIGURE 3-46Cryoelectron microscopy analysis of the structure of the human mitochondrial ribosome. The mitochondrion is a complex, multifunctional intracellular organelle best known for its ability to synthesize the energy carrier ATP (see Chapter 12). Human mitochondria can synthesize proteins encoded by mitochondrial DNA using large (1.7 MDa), multi-protein (at least 78) and multi-RNA complexes called mitochondrial ribosomes that differ somewhat from cytoplasmic ribosomes. (a) Cryoelectron micrograph of isolated human mitochondrial ribosomes. The low contrast between the ribosomes and the buffer solution makes it difficult to clearly see individual, frozen ribosome particles, which are oriented randomly in the image. (b) Automated image processing of 323,292 individual particles permits their grouping into classes based on orientation and averaging of the images within each class to generate clearer images of the ribosome. (c) Additional computational analysis generates distinct structures, each based on tens of thousands of individual particles (the number of particles analyzed for each structure in thousands [K] is shown beneath each). The structures enclosed in boxes were selected for additional analysis, which produced the two very similar models shown in (d) containing virtually identical large subunits. (e) Color-coded, low-resolution model of the electron density of the large (blue) and small (yellow) subunits. The conformational heterogeneity of the small subunit prevented its high-resolution structure determination from the data shown here. (f) High-magnification view of the experimentally determined electron density (meshwork) from a portion of one of the proteins in the large subunit illustrates how the electron density is used to build the superimposed molecular model of polypeptide chains. In this very small portion of one protein within the large subunit, the side chains of proline (Pro), phenylalanine (Phe), valine (Val), and tyrosine (Tyr) residues are easily seen and demonstrate the power of cryoelectron microscopy to determine protein structures at very high resolutions. (g) Model of the 48 protein subunits (different colors) in the large subunit determined at 3.4 Å resolution.
[Republished with permission of American Association for the Advancement of Science, from Brown, A., et al, “Structure of the large ribosomal subunit from human mitochondria.” Science, 2014, 346 (6210): 718-722; permission conveyed through Copyright Clearance Center, Inc.]
Page 121
NMR Spectroscopy The three-dimensional structures of small proteins containing as many as 200 amino acids can be studied routinely with nuclear magnetic resonance (NMR) spectroscopy, and specialized approaches can be used to extend the size range to somewhat larger proteins. In this technique, a concentrated protein solution is placed in a magnetic field, and the effects of different radio frequencies on the nuclear spin states of different atoms are measured. The spin state of any atom is influenced by neighboring atoms in adjacent residues, with closely spaced residues having a greater effect than distant residues. From the magnitude of the effect, the distances between residues can be calculated by a triangulation-like process; these distances are then used to generate a model of the three-dimensional structure of the protein. An important distinction between x-ray crystallography and NMR spectroscopy is that the former method directly determines the locations of the atoms, while the latter directly determines the distances between the atoms, from which the structure is deduced.
Although NMR does not require the crystallization of a protein—a definite advantage—this technique is usually limited to proteins smaller than about 50 kDa (although new techniques permit analysis of the dynamics in much larger proteins). However, NMR analysis can provide information about the ability of a protein to adopt a set of closely related, but not exactly identical, conformations and to move between those conformations (protein dynamics). This is a common feature of proteins, which are not absolutely rigid structures, but can “breathe” or exhibit slight variations in the relative positions of their constituent atoms. In some cases, these variations can have functional significance; for example, they may influence how proteins bind to one another. NMR structural analysis has been particularly useful in studying isolated protein domains, which can often be obtained as stable structures and tend to be small enough for this technique. To date, there are more than 10,000 NMR-determined structures available in the Protein Data Bank.
Another powerful approach to studying protein dynamics and protein-protein interactions is hydrogen/deuterium exchange mass spectrometry (HXMS). When a protein is placed in a deuterated water (D2O) solution, the rate at which deuterium is exchanged for hydrogen in the amides in the peptide bonds depends on the accessibility of an amide to the solvent. Those amides exposed on the protein’s surface are highly accessible and exhibit rapid proton/deuterium exchange. Those amides buried in the center of the protein or in a protein-to-protein interface, as well as those participating in hydrogen bonds with other parts of the protein, exhibit slower proton/deuterium exchange rates. A change in protein conformation or binding to other molecules has the potential to alter the rate of hydrogen/deuterium exchange of one or more amides of a protein. MS analysis permits a hypersensitive assay of such conformational changes, allowing the identification of those parts of the protein that directly bind to other molecules or undergo such conformational changes.