14.3 Multiple Regression
An orthogonal variable is an independent variable that makes a separate and distinct contribution in the prediction of a dependent variable, as compared with the contributions of another variable.
In regression analysis, we explain more of the variability in the dependent variable if we can discover genuine predictors that are separate and distinct. This involves orthogonal variables, independent variables that make separate and distinct contributions in the prediction of a dependent variable, as compared with the contributions of other variables. Orthogonal variables do not overlap each other. For example, the study we discussed earlier explored whether the amount of Facebook use predicted social capital. It is likely that a person’s personality also predicts social capital; for example, we would expect extroverted, or outgoing, people to be more likely to have this kind of social capital than introverted, or shy, people. It would be useful to separate the effects of the amount of Facebook use and extroversion on social capital.
The statistical technique we consider next is a way of quantifying (1) whether multiple pieces of evidence really are better than one, and (2) precisely how much better each additional piece of evidence actually is.
Understanding the Equation
Multiple regression is a statistical technique that includes two or more predictor variables in a prediction equation.
Just as a regression equation using one independent variable is a better predictor than the mean, a regression equation using more than one independent variable is likely to be an even better predictor. This makes sense in the same way that knowing a baseball player’s historical batting average plus knowing that the player continues to suffer from a serious injury is likely to improve our ability to predict the player’s future performance. So it is not surprising that multiple regression is far more common than simple linear regression. Multiple regression is a statistical technique that includes two or more predictor variables in a prediction equation.
MASTERING THE CONCEPT
14-
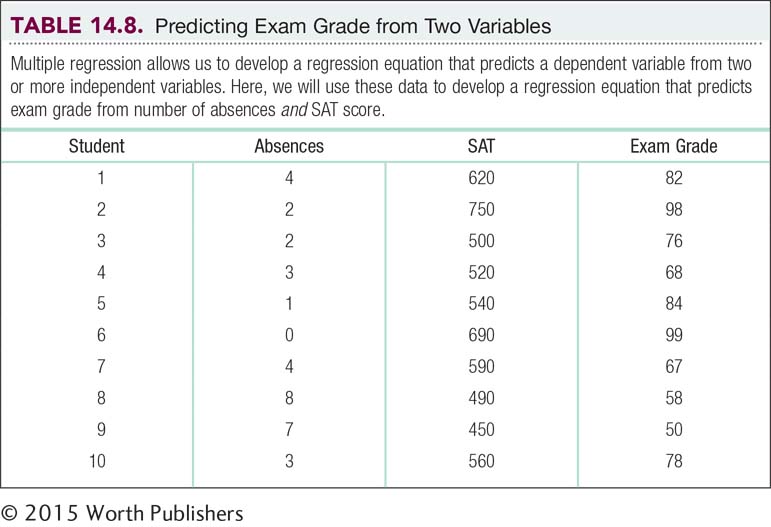
Let’s examine an equation that might be used to predict a final exam grade from two variables, number of absences and score on the mathematics portion of the SAT. Table 14-8 repeats the data from Table 14-1, with the added variable of SAT score. (Note that although the scores on number of absences and final exam grade are real-
The computer gives us the printout seen in Figure 14-7. The column in which we’re interested is the one labeled “B,” under “Unstandardized Coefficients.” The first number, across from “(Constant),” is the intercept. The intercept is called constant because it does not change; it is not multiplied by any value of an independent variable. The intercept here is 33.422. The second number is the slope for the independent variable, number of absences. Number of absences is negatively correlated with final exam grade, so the slope, –3.340, is negative. The third number in this column is the slope for the independent variable of SAT score. As we might guess, SAT score and final exam grade are positively correlated; a student with a high SAT score tends to have a higher final exam grade. So the slope, 0.094, is positive. We can put these numbers into a regression equation, with X1 representing the first variable, SAT score, and X2 representing the second variable, final exam grade:
Ŷ = 33.422 – 3.34(X1) + 0.094(X2)
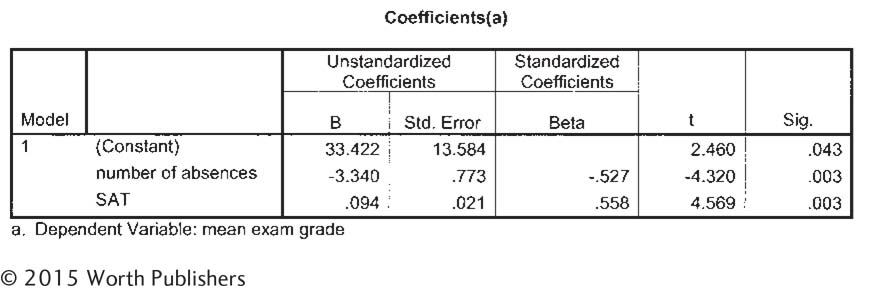
Software Output for Regression
Computer software provides the information necessary for the multiple regression equation. All necessary coefficients are in column B under “Unstandardized Coefficients.” The constant, 33.422, is the intercept; the number next to “Number of absences,” –3.340, is the slope for that independent variable; and the number next to “SAT,” .094, is the slope for that independent variable.
Once we develop the multiple regression equation, we can input raw scores on number of absences and mathematics SAT score to determine a student’s predicted score on Y. Imagine that our student, Allie, scored 600 on the mathematics portion of the SAT. We already know she planned to miss two classes this semester. What would we predict her final exam grade to be?
Ŷ = 33.422 – 3.34(X1) + 0.094(X2)
= 33.422 – 3.34(2) + 0.094(600)
= 33.422 – 6.68 + 56.4 = 83.142
Based on these two variables, we predict a final exam grade of 83.142 for Allie. How good is this multiple regression equation? From software, we calculated that the proportionate reduction in error for this equation is a whopping 0.93. By using a multiple regression equation with the independent variables of number of absences and SAT score, we have reduced 93% of the error that would result from predicting the mean of 76 for everyone.
When we calculate proportionate reduction in error for a multiple regression, the symbol changes slightly. The symbol is now R2 instead of r2. The capitalization of this statistic is an indication that the proportionate reduction in error is based on more than one independent variable.
Multiple Regression in Everyday Life
With the development of increasingly more powerful computers and the availability of ever-
Bing Travel is an attempt at an end run, using mathematical prediction tools, to help savvy airline consumers either beat or wait out the airlines’ price hikes. In 2007, Bing Travel’s precursor, Farecast.com, claimed a 74.5% accuracy rate for its predictions. Zillow.com does for real estate what Bing Travel does for airline tickets. Using archival land records, Zillow predicts U.S. housing prices and claims to be accurate to within 10% of the actual selling price of a given home.
Amazon.com is trying to take the prediction game to a new level. In 2014 they filed a patent for something called “anticipatory shipping” (Bensinger, 2014). Amazon could take advantage of their immense database of customer information to ship products to distribution centers closer to customers, or even load products onto trucks—
CHECK YOUR LEARNING
| Reviewing the Concepts |
|
|
| Clarifying the Concepts | 14- |
What is multiple regression, and what are its benefits over simple linear regression? |
| Calculating the Statistics | 14- |
Write the equation for the line of prediction using the following output from a multiple regression analysis: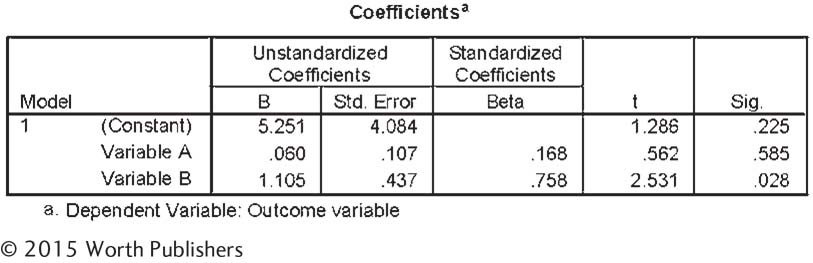
|
| 14- |
Use the equation for the line you created in Check Your Learning 14-
|
|
| Applying the Concepts | 14- |
The accompanying computer printout shows a regression equation that predicts GPA from three independent variables: hours slept per night, hours studied per week, and admiration for Pamela Anderson, the B-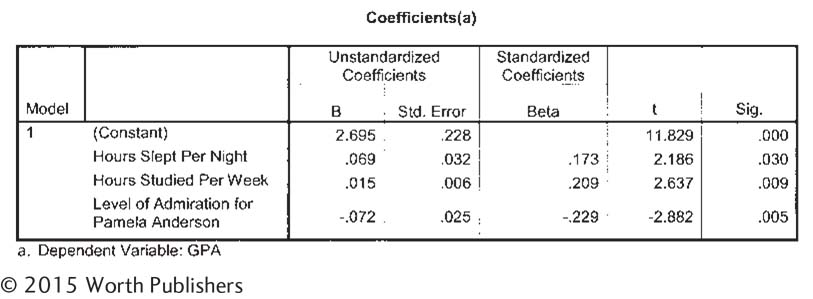
|
Solutions to these Check Your Learning questions can be found in Appendix D.