7.5 SPSS®
SPSS can be used to transform raw data from different scales into standardized data on one scale based on the z distribution, allowing us to look at standardized scores instead of raw scores. We can try this using the numbers of first-
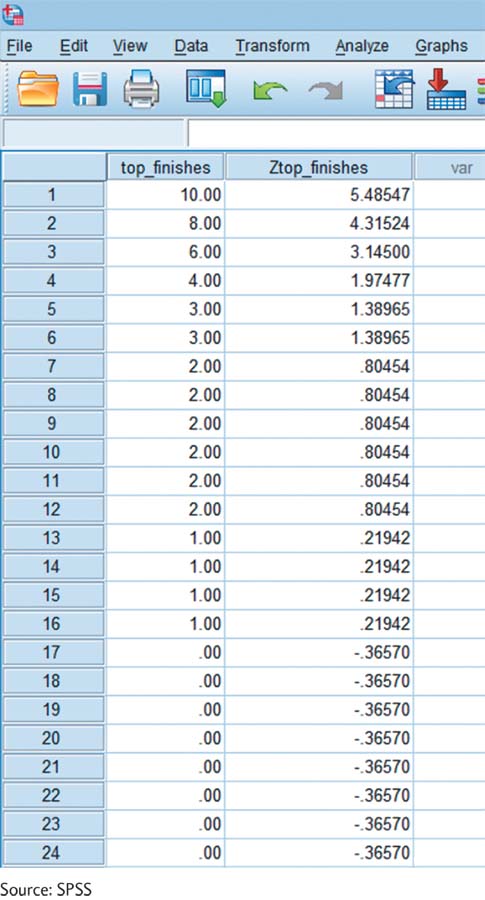
To standardize the variable “top_finishes,” select: Analyze → Descriptive Statistics → Descriptives. Select the relevant variable by clicking it on the left side, then clicking the arrow to move it to the right. Check the “Save standardized values as variables” box and click “OK.” Part of the new column of standardized variables under the heading “Ztop_finishes” is in the accompanying screenshot.