Early Studies of DNA
In 1868, Johann Friedrich Miescher graduated from medical school in Switzerland. Influenced by an uncle who believed that the key to understanding disease lay in the chemistry of tissues, Miescher traveled to Tübingen, Germany, to study under Ernst Felix Hoppe-
By 1887, several researchers had independently concluded that the physical basis of heredity lies in the nucleus. The material that Miescher had isolated (chromatin) was shown to consist of nucleic acid and proteins, but which of these substances was actually the genetic information was not clear. In the late 1800s, Albrecht Kossel carried out further work on the chemistry of DNA and determined that it contains four nitrogenous bases: adenine, cytosine, guanine, and thymine (abbreviated A, C, G, and T).
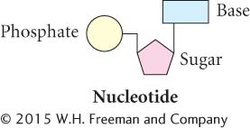
Phoebus Aaron Levene later showed that DNA consists of a large number of linked, repeating units called nucleotides; each nucleotide contains a sugar, a phosphate, and a base.
Levene incorrectly proposed that DNA consists of a series of four-
As additional studies of the chemistry of DNA were completed in the 1940s and 1950s, this notion of DNA as a simple, invariant molecule began to change. Erwin Chargaff and his colleagues carefully measured the amounts of the four bases in DNA from a variety of organisms and found that DNA from different organisms varies greatly in base composition. This finding disproved the tetranucleotide hypothesis. They discovered that, within each species, there is some regularity in the ratios of the bases: the amount of adenine is always equal to the amount of thymine (A = T), and the amount of guanine is always equal to the amount of cytosine (G = C; Table 8.1). These findings became known as Chargaff’s rules.
| Base composition | Ratio | ||||||
|---|---|---|---|---|---|---|---|
| Source of DNA |
A | T | G | C | A/T | G/C | (A + G)/ (T + C) |
| E. coli | 26.0 | 23.9 | 24.9 | 25.2 | 1.09 | 0.99 | 1.04 |
| Yeast | 31.3 | 32.9 | 18.7 | 17.1 | 0.95 | 1.09 | 1.00 |
| Sea urchin | 32.8 | 32.1 | 17.7 | 18.4 | 1.02 | 0.96 | 1.00 |
| Rat | 28.6 | 28.4 | 21.4 | 21.5 | 1.01 | 1.00 | 1.00 |
| Human | 30.3 | 30.3 | 19.5 | 19.9 | 1.00 | 0.98 | 0.99 |
|
*Percentage in moles of nitrogenous constituents per 100 g- |
|||||||
CONCEPTS
Details of the structure of DNA were worked out by a number of scientists. At first, DNA was interpreted as being too regular in structure to carry genetic information, but by the 1940s, DNA from different organisms was shown to vary in its base composition.