CONCEPT44.3 Community Structure Affects Community Function
It is useful to think of an ecological community as a dynamic system (see Concept 1.2) similar to a human-made machine, with inputs, “internal workings,” and outputs. The inputs to a community are energy and materials from the surrounding abiotic environment. The “internal workings” of the community—the metabolism of its individuals, the dynamics of its populations, and the interactions among its species—produce an output of transformed energy and materials.
Energy flux is a critical aspect of community function
If we think of a community as a machine, we can measure community function as we would the function of a machine, in terms of its inputs and outputs. Community function is measured by the amount of energy or matter that moves into and out of the community per unit of time. This flux, or flow rate, reflects an exchange between the community and its environment. We can also measure function for particular parts of the community. Wolves, for example, convert elk into new wolves—a conversion of primary consumers (an input) into secondary consumers (an output). The output of seeds and fruits by most flowering plants, including Coffea arabica, responds to visits by insect pollinators, a type of input. Retention of nutrients within an ecosystem is a function of the community’s decomposers—the recyclers. Many community outputs affect not only species in the community, but also organisms in other ecosystems, including humans. These outputs represent “goods” and “services,” which we will discuss in Concept 44.5.
LINK
The role of decomposers in recycling nutrients—particularly nitrogen—is described in Concept 45.3
To develop this idea of community function, let’s first focus on how energy moves through communities. (The flux of matter through communities is coupled with that of energy, as will become more apparent in Chapter 45.) FIGURE 44.6 shows, in simplified form, the flux of energy through the most common type of food web, in which the primary producers are photosynthetic organisms that use the sun’s energy. The pattern of energy flux is similar in those rare communities (such as those in deep-sea hydrothermal vents) in which primary producers are chemoautotrophs.
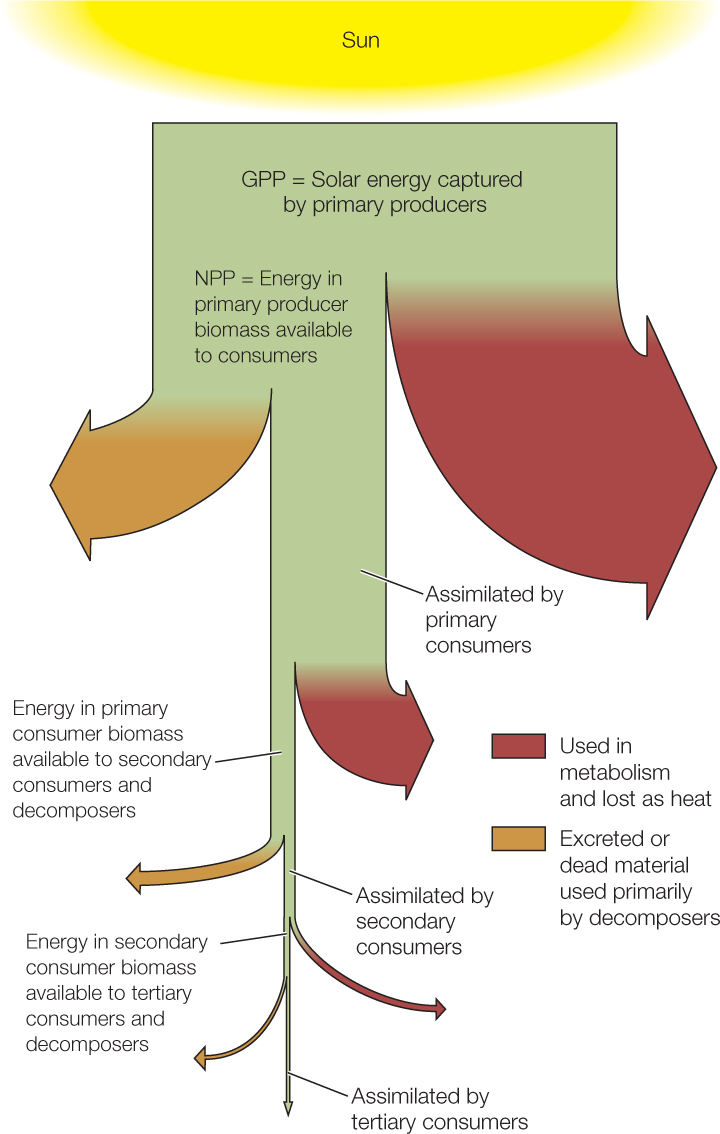
Energy enters communities through primary producers; the total amount of energy that they capture and convert to chemical energy per unit of time is called gross primary productivity (GPP). Not all of the captured energy is available to primary consumers because primary producers use some of it to fuel cellular respiration and other catabolic processes. Ultimately this energy is lost as heat. The amount of energy stored in primary producer tissues per unit of time is called net primary productivity (NPP). GPP and NPP reflect two aspects of primary producer function: the rate at which primary producers capture energy, and the rate at which they convert it to forms available to other trophic levels. GPP can be measured from the rate with which primary producers take up carbon dioxide during photosynthesis, and NPP from the rate of CO2 uptake minus its rate of release during respiration. New technologies allow us to measure such gas exchanges in nature, but it is often more convenient to use change in the biomass of primary producers (the dry mass of their tissues) per unit of time as an approximation for NPP.
The percentage of the energy contained in the biomass of one trophic level that is incorporated into biomass in the next trophic level is the ecological efficiency of energy transfer between those levels. Ecological efficiency of energy transfer averages only about 10 percent—the biomass of one trophic level is about 10 percent of that in the next lower level.
904
LINK
Food-web structure is discussed in Concept 43.3; see especially Table 43.1 and Figure 43.6. You can review photosynthesis and cellular respiration in Chapter 6; see especially Concepts 6.2 and 6.5 and Figure 6.14
Just as NPP measures primary producer function, the biomass produced by primary consumers measures how well they function to convert primary producer tissue into their own tissue, and so on for secondary and tertiary consumers. The low efficiency of these energy transfers limits the number of trophic levels found in a community—few contain more than four—because fewer and fewer individuals can be supported as one moves to higher trophic levels. This is one reason we sometimes are urged to “eat low on the food chain”: more humans can be fed if we act as primary consumers than if we act as secondary consumers.
There are several reasons for low ecological efficiency. First, not all the biomass at one trophic level is ingested by the next one; for example, herbivores routinely miss hard-to-get plant parts or avoid eating plants that are chemically well defended. Second, some ingested matter is indigestible and is excreted as waste. Tree bark, for example, contains lignin and cellulose, which most herbivores cannot digest. Finally, and most important, consumers as well as primary producers use much of the energy they assimilate (the digested portion of what they ingest) to fuel aspects of their own metabolism that do not add new biomass through growth or reproduction. Energy used in metabolism does the work of assembling and disassembling biological molecules, moving the body, and so on, and heat is generated in the process. Except for the energy stored in the chemical bonds of assembled molecules, none of the energy used in metabolism is available to the next trophic level.
Community function is affected by species diversity
The structure of a community influences how much energy enters it and how much is transferred through the food web because each species has a unique niche that determines its function in the community. The niche is a central ecological concept with two important meanings. The first meaning refers to the physical and biological environments in which a species has a positive per capita growth rate—these are the environments where we expect to find that species. Figure 42.7 shows, for example, that the niche of the beetle Rhyzopertha dominica includes drier and warmer conditions than that of Sitophilus oryzae. Physical tolerances do not completely define a species’ niche, however, because the biological environment—the presence of competitors, predators, and so on—also affects population growth. Figure 43.4 shows, for example, that low intertidal zones are included in the niche of stellate barnacles only where rock barnacles are absent.
A species’ niche also refers to what the species does in the community—its functional role, or “profession.” This role is largely defined by how it affects other species—what resources it uses and makes unavailable to other species, when and where it obtains them, how efficiently it does so, what it produces from them that other species can use, and whether it affects the physical environment. Many of these effects, but not all of them, are determined by the species’ trophic interactions.
Once we think of functional roles, we can begin to see that community structure affects community function. Loss of wolves from Yellowstone National Park in the 1920s, for example, decreased the flux of energy from elk to secondary consumers and increased energy flux from aspen and willow to primary consumers (see Figures 43.6 and 43.7). But how do we go from specific examples like this to a more general understanding of how structure affects function? Ecologists have begun to tackle this problem by looking for broad patterns in structure–function relationships across communities. They have discovered that one important aspect of community structure—species diversity—influences community function.
905
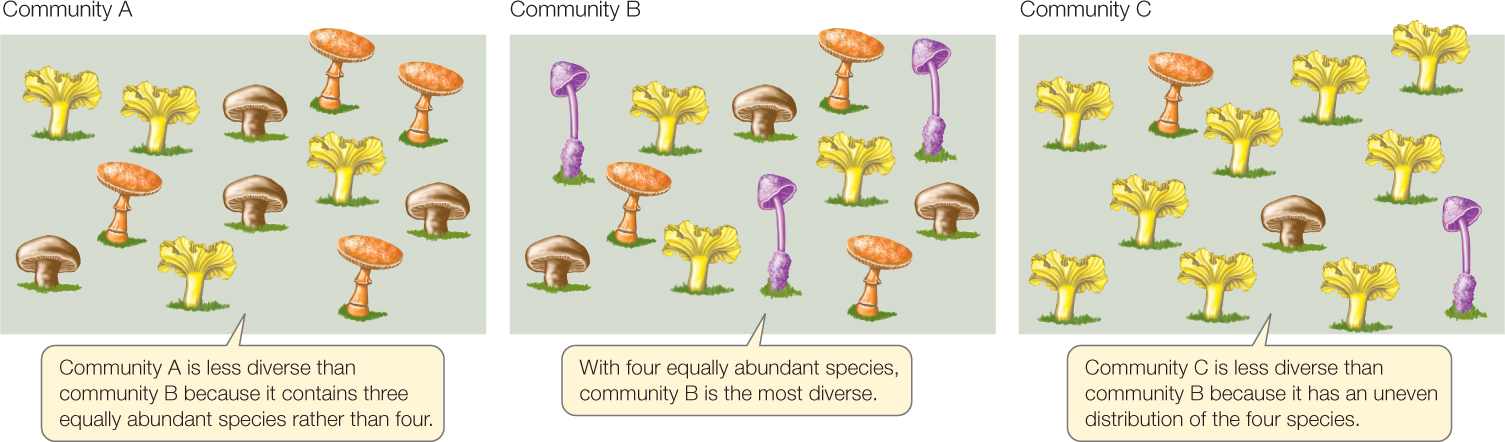
Species diversity has two components, illustrated in FIGURE 44.7. One is simply the number of species in the community, called species richness. A community that contains more species is more diverse, all else being equal. The second component is how similar the species are in their abundances, a property called species evenness. A community that has four equally abundant species is more diverse than one in which 75 percent of the individuals belong to one species and the remaining 25 percent are spread among three other species. This second component may not be intuitive until we understand how it affects communities: the properties of a community with a few abundant species will be defined mostly by those species, whereas the properties of a community with equally abundant species will reflect the influence of all of them. Ecologists sometimes use species richness as a simple measure of diversity, but often prefer to use a mathematical diversity index that incorporates both richness and evenness.
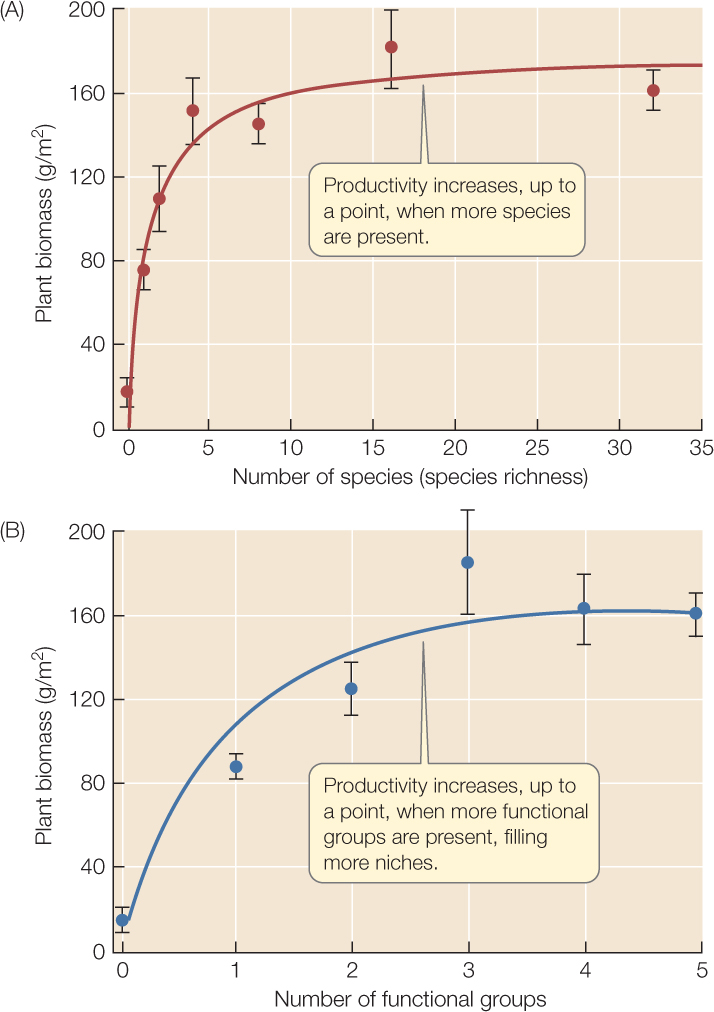
Community outputs often vary with species diversity. In a long-term study of prairie plant communities, for instance, David Tilman and his colleagues at the University of Minnesota cleared outdoor plots into which they planted up to 32 native prairie species. After the plantings had reached maturity, they harvested the plants and measured their aboveground biomass. They found that this measure of NPP increased as the species richness of a plot increased (FIGURE 44.8A).
Two hypotheses have been proposed for such an increase. First, the relationship may come from “sampling”: communities with more species may be more likely, just by chance, to include some “superspecies” that are exceptionally good at predation, or at photosynthesizing, or at whatever they do, and so have a strong influence on total community output.
906
Alternatively, the relationship may come from “niche complementarity”: differences (often subtle) among species in how efficiently they use alternative resources under different conditions. (This idea is related to resource partitioning; see Figure 43.5). For example, “C4” grasses, which have a special type of photosynthesis, grow better than “C3” grasses in warm conditions but worse in cool conditions; symbiotic nitrogen-fixing bacteria give legumes a boost in nutrient-poor soils but are a drain in nutrient-rich soils; shrubs and trees can tap the nutrients and water in deeper soil layers than can herbaceous species. Species-rich communities may be more likely than species-poor communities to contain representatives of several such complementary “functional groups” that together make more complete use of available resources. (To see this idea, consider how total consumption of seed resources in Figure 43.5 would change if Species B were removed from the hypothetical community.) Tilman and colleagues could test these two hypotheses because they planted some species-rich plots with multiple species from only one functional group, and others with species from several functional groups. They found that NPP increased with the number of functional groups, and that the number of species within functional groups had no additional effect on NPP (FIGURE 44.8B). This result suggested that niche complementarity caused the relationship between species richness and NPP.
LINK
Some ways in which differences in resource use evolve and promote species coexistence are described in Concepts 43.2 and 43.4
NPP is not the only measure of community function that increases with species diversity. Control of agricultural pests by natural predators and parasites is enhanced when multiple crops are planted together or when a diverse natural plant community borders agricultural fields. And as we’ll see at the end of this chapter, two recent studies of coffee pollination found that the production of seeds was higher, and pollination rates were less variable between years, in plantations that were close to natural tropical forests, which harbor a great diversity of coffee-visiting bee species.
CHECKpointCONCEPT44.3
- What is the major source of energy for communities, and how does it enter them?
- What is ecological efficiency, and how does it influence the number of trophic levels in a community?
- Discuss parallels between the two components of species diversity and components of cultural and ethnic diversity in human societies.
- What would Tilman and colleagues have seen if “sampling” explained the relationship between species richness and NPP?
Species diversity is an important characteristic of communities because it affects how those communities function as ecological systems. But what factors determine species diversity in a particular community?