2.10 SOCIOCULTURAL ISSUES
North America is increasingly diverse, with new immigrants from across the globe adding to a dominant culture that has European roots.
Immigration and Diversity
Immigration has played a central role in populating both the United States and Canada. Most people in North America descend from European immigrants, but there are many who have roots in Africa, Asia, Middle and South America, and Oceania. New waves of migration from Middle and South America and parts of Asia promise to make North America a region where people of non- 50. IMMIGRATION AND POPULATION REPORT
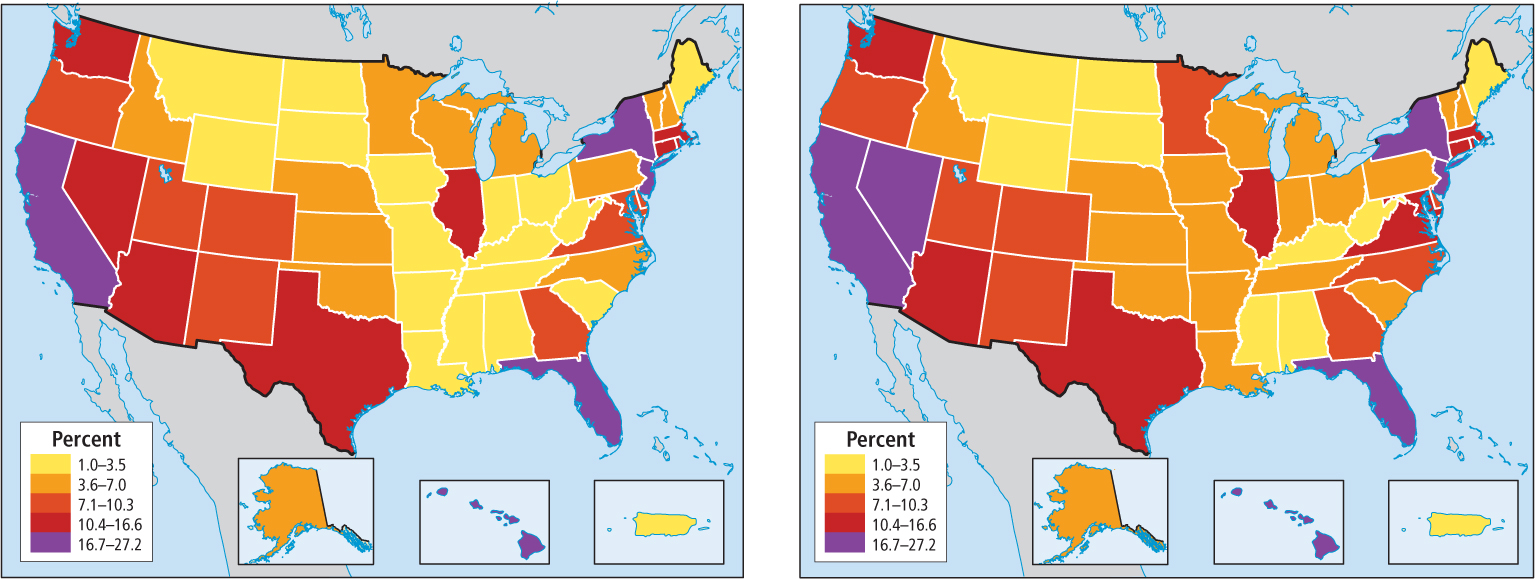
In the United States, the spatial pattern of immigration is also changing. For decades, immigrants settled mainly in coastal or border states such as New York, Florida, Texas, or California. However, since about 1990, immigrants have been increasingly settling in interior states such as Illinois, Colorado, Nevada, and Utah (see Figure 2.28). The influence of immigrants can also be seen in many aspects of life in North America, including the popularity of ethnic cuisines (Figure 2.29).

Why Do People Decide to Immigrate to North America? The decision to leave one’s homeland is usually not an easy one. There are almost always push factors that cause people to consider the drastic move of leaving family and friends and familiar places to strike out into the unknown, with what are usually limited resources. These push factors can be civil or political unrest, or some kind of discrimination, but most often the lack of economic opportunity and the curbs on upward mobility that cause people to overcome the natural resistance to leaving home. Recently, the forces of globalization have often been the root causes of these push factors. For example, when NAFTA encouraged large U.S. agribusinesses to relocate to Mexico to grow corn on a massive scale, small Mexican corn farmers were dislodged from land they had traditionally worked; others found they could not compete on price and had to give up farming. Yet all these farmers had families to feed and educate, so often fathers and their brothers and sons migrated north in search of work. In Texas, California, or Tennessee, they worked in construction or as field laborers, lived frugally, and sent most of their earnings home. Some entered the United States legally, but many—
push factors factors that get people to consider the drastic move of leaving family and friends and a familiar place to strike out into the unknown, with what are usually unknown resources
Do New Immigrants Cost U.S. Taxpayers Too Much Money?
Many North Americans are concerned that immigrants burden schools, hospitals, and government services. And yet numerous studies have shown that, over the long run, immigrants contribute more to the U.S. economy than they cost. Legal immigrants have passed an exhaustive screening process that assures they will be self-
On average, immigrants are healthier and live longer than native U.S. residents, according to a 2004 study by the National Institutes of Health (NIH). They therefore represent less drain on the health care and social service systems than do native residents. The NIH attributes this difference to a stronger work ethic, a healthier lifestyle that includes more daily physical activity, and the more nutritious eating patterns of new residents compared to those of U.S. society at large. Unfortunately, these healthy practices tend to diminish the longer immigrants are in the country, and the more healthy status does not carry over to immigrants’ children, who are nearly as likely to suffer from obesity as native-
Do Immigrants Take Jobs Away from U.S. Citizens? The least educated, least skilled American workers are the most likely to end up competing with immigrants for jobs. In a local area, a large pool of immigrant labor can drive down wages in fields like roofing, landscaping, and general construction. Immigrants with little education now fill many of the very lowest-
It is often argued that U.S. citizens have rejected these jobs because of their low pay, which results in immigrants being needed to fill the jobs. Others say that these jobs might pay more and thus be more attractive to U.S. citizens if there were not a large pool of immigrants ready to do the work for less pay. Research has failed to clarify the issue. Some studies show that immigrants have driven down wages by 7.4 percent for U.S. natives without a high school diploma. However, other studies show no drop in wages at all. Employers across the country speak of the superior work ethic of immigrants, especially in the construction industry, which makes them happy to pay these workers decent wages.
Professionals in the United States occasionally compete with highly trained immigrants for jobs, but such competition is usually in occupations where there is a scarcity of native-
Are Too Many Immigrants Being Admitted to the United States? Many people are concerned that immigrants are coming in such large numbers that they will strain resources here. There is some validity to this. Immigrants and their children accounted for 78 percent of the U.S. population growth in the 1990s. At the current rate of entry, by the year 2050, the U.S. population would reach 422.6 million (down 20 million from estimates in 2008), with immigration accounting for the majority of the increase. But one of the problems with making these projections is that no one really knows how much undocumented (illegal) immigration there is. Most research indicates that it has reached unprecedented levels over the past 30 years, possibly exceeding legal immigration rates since the mid-
Undocumented immigrants tend to lack skills, and they are not screened for criminal background, as are all legal immigrants. However, research also shows that undocumented immigrants are not only less likely to partake of social services, but also less likely to participate in criminal behavior than the general population, with only tiny percentages of them having committed offenses. Further analysis of the 2010 census will help researchers formulate factually based conclusions about the effects of illegal immigration.
Research shows that the decision to migrate without legal documentation is a very difficult one, undertaken because of severely limited economic, educational, and social opportunities at home. Few Americans are aware that children of all ages get caught up in these migration patterns, and their migratory experiences remain largely unrecorded. Despite tougher border security and declining adult immigration nationally and internationally, the numbers of unaccompanied children stopped at the border continually increase, illustrating yet one more of the complexities of immigration.
VIGNETTE
Every youth who arrives at the border detention shelter in Arizona writes a life story in a creative writing class. A 14-
Three years before, at the peak of the global recession, her then-
Within days, the brothers sent their sister all of their savings—
In the 2 months it took her to arrive, she lost contact with her brothers. Lacking family contacts and money, her deportation is likely. Her biggest desire is “to work hard and give the money back to my brothers.” [Source: Material for this vignette was pieced together by Lydia Pulsipher in April 2012 from personal correspondence with Elizabeth Kennedy and Stuart Aitken, geographers who participate in the ISYS Unaccompanied Minors project.]
Race and Ethnicity in North America
Despite strong scientific evidence to the contrary, people across the world still perceive skin color and other visible anatomical features to be significant markers of intelligence and ability. This racialized view of skin color is partially a remnant of European colonialism, which was based on assigning some to a perpetually low status while giving others privilege. As discussed previously (see Chapter 1), the science of biology tells us there is no scientific validity to such assumptions and practices. The same is true for ethnicity, which is the cultural counterpart to race, in that people may ascribe overwhelming (and unwarranted) significance to cultural characteristics such as religion, family structure, or gender customs. Thus, race and ethnicity are very important sociocultural factors not because they have to be, but because people make them so.
ethnicity the quality of belonging to a particular culture group
Extending Equal Opportunity Numerous surveys show that a large majority of Americans of all backgrounds favor equal opportunities for minority groups. Nonetheless, in both the United States and Canada, many middle-
Diversity is increasing across North America as is the acceptance of diversity. Take, for example, the enthusiasm with which various cultural festivals are attended by Americans regardless of their ethnic heritage (Figure 2.31). Still, the issue of race remains important in both the United States and Canada, where whiteness is considered the norm and African Americans, Native Americans and First Nations people, and Latinos often find themselves seen as exceptions to the norm. Prejudice has clearly hampered the ability of these three groups to reach social and economic equality with Americans of other ethnic backgrounds. In the United States—

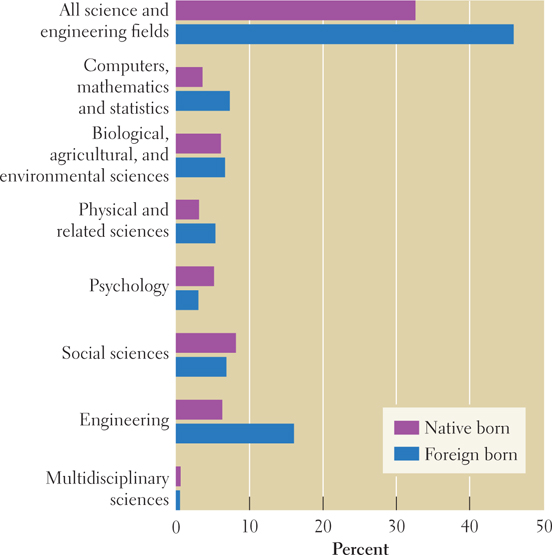
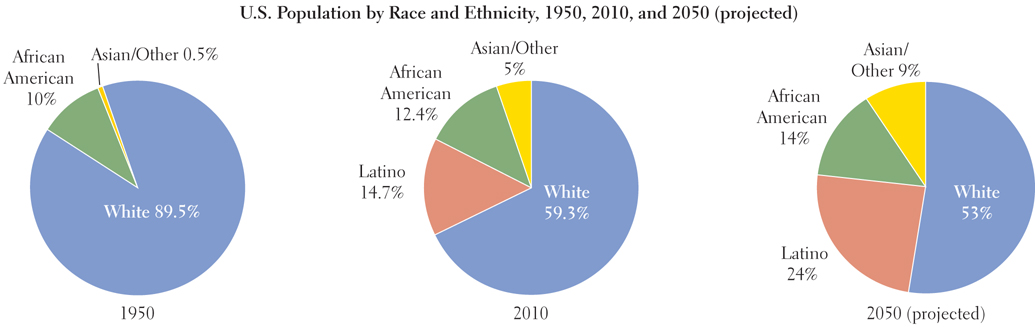
Figure 2.32 shows the changes in the ethnic composition of the North American population from 1950 to 2010, and the projected changes for 2050. In 2001, Latinos overtook African Americans as the largest minority group in the United States. Because of a higher birth rate and a high immigration rate, the Latino population increased by 58 percent in the 1990s, to 14.7 percent of the total population by 2010. By 2010, Asian Americans made up just 5 percent of the U.S. population, but their numbers increased by 80 percent between 1990 and 2010. Of the foreign-
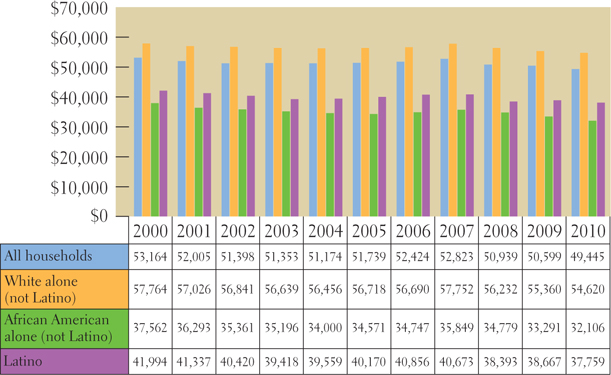
Income Discrepancies Over the past few decades, many non–
The Culture of Poverty Is anything other than prejudice holding back some in these ethnic minority groups? Some social scientists suggest that persistently disadvantaged Americans of all ethnic backgrounds may suffer from a culture of poverty, meaning that poverty itself forces coping strategies that are counterproductive to social advancement. Plans to get higher education, for example, must be abandoned because of lack of funds. This and low social status have bred the perception among the poor that there is no hope for those trapped in the culture of poverty and therefore no point in trying to succeed. This perception is perpetuated and even exaggerated by a daily existence on the fringes of American mainstream life. The reality is that these poorest people rarely encounter examples of success, and they have few opportunities to complete a collegiate education, be hired into jobs with livable wages, or find a decent dwelling.
One component in the culture of poverty is the growing numbers of low-
Another particularly geographic aspect of the culture of poverty is that it is part of a larger problem of economic and social spatial segregation based on class. In both the United States and Canada, the increasingly prosperous middle class, of whatever race or ethnicity, has moved to the suburbs—
Religion
Because so many early immigrants to North America were Christian in their home countries, Christianity is currently the predominant religious affiliation in North America. In surveys taken in 2012, seventy-
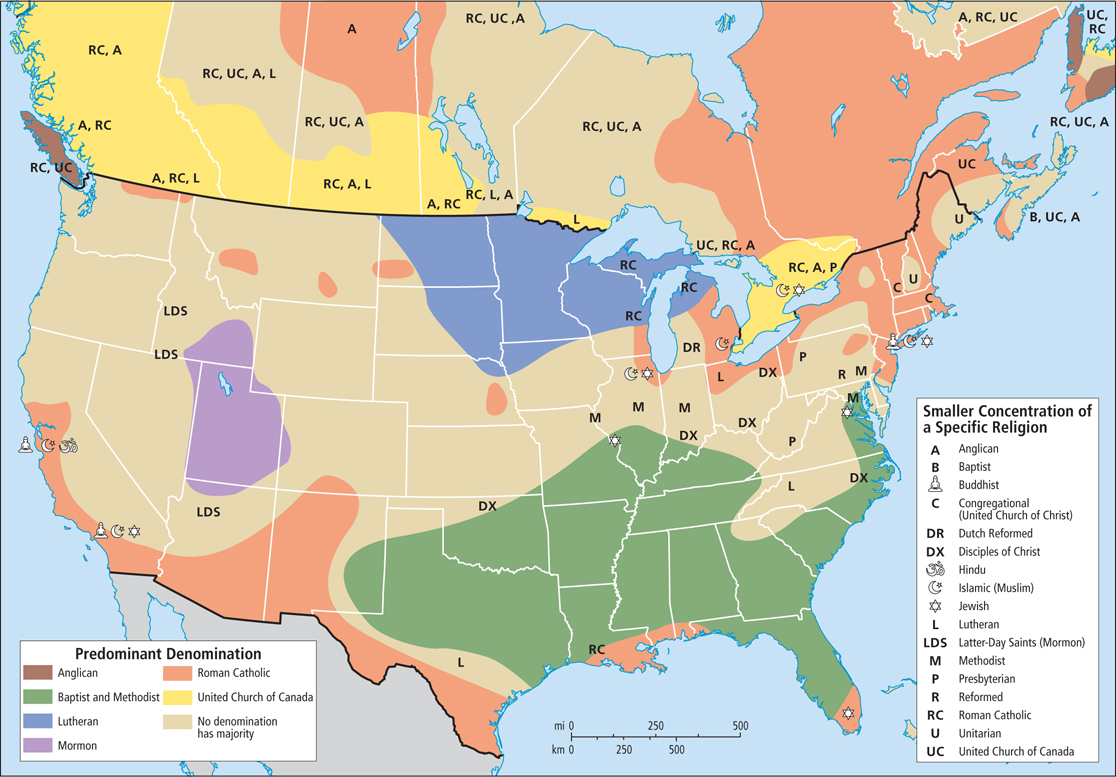
The Geography of Christian Subgroups There are many versions of Christianity in North America, and their geographic distributions are closely linked to the settlement patterns of the immigrants who brought them here (see Figure 2.34). Roman Catholicism dominates in regions where Latino, French, Irish, and Italian people have settled—
Baptists, particularly Southern Baptists and other evangelical Christians, are prominent in the “Bible Belt,” which stretches across the Southeast from Texas and Oklahoma to the Eastern Seaboard. Evangelical Christianity is such an important part of community life in the South that frequently the first question newcomers to the region are asked is what church they attend.
The Relationship of Religion and Politics Just how interactive religion and politics should be in North American life has long been a controversial issue in the United States, more so than in Canada. This is true in large part because the framers of the U.S. Constitution, in an effort to ensure religious freedom, supported the idea that church and state should remain separate. In the past three decades, however, many conservative Christians have successfully pushed for a closer integration of religion and public life. Their political goals include banning abortion, promoting prayer in the public schools, teaching the biblical version of creation instead of teaching evolution, and preventing gays and lesbians from participating openly in the public sphere and marrying each other.
ON THE BRIGHT SIDE
More Discussion of Race and Racism
In 2008 and again in 2012, the United States made history by electing its first African American president. Some commentators mistakenly heralded this as the end of racism and of the need to even talk about race. As if to prove them wrong, an avalanche of racially charged stories entered the news cycle of the mainstream national media. For example, in 2012 national news media focused on the shooting of Trayvon Martin, an unarmed black teenager, by George Zimmerman, a neighborhood watch coordinator in the gated community near Orlando, Florida, where Martin was living temporarily. Coverage of these stories produced an outpouring of discussion, protests, and other actions aimed at raising awareness of race in the United States.
Lost in much of the discussion was the fact that shootings like this, even though they are quite common, have historically rarely made even the local news, much less the national news. Currently, most major U.S. national news outlets feature an entire section on “race and ethnicity,” at least in their online offerings, which was entirely absent just a few years ago. It may be a long time before any person’s or organization’s claims to be “beyond race” ring true in the United States, but at least the subject is receiving more attention and being more openly discussed.
New immigrants have brought their own faiths and belief systems, and they are contributing to the debate about religion and public life. Muslims, as yet a tiny minority, have had trouble gaining the same rights as other religious minorities, such as Buddhists or Jews. Some immigrants leave their traditional faith and adopt another. Such is the case with the 15 percent of Latino immigrants to the United States who have left the Roman Catholic faith, either while still in their home country or after immigrating, and are now evangelical Christians. In Canada, Catholicism is growing.
National surveys have consistently indicated that a substantial majority of North Americans favor the separation of church and state and support personal choice in belief and behavior.
The American Family
The family is often seen as endangered by North America’s fast-
nuclear family a family consisting of a married father and mother and their children
The Nuclear Family Becomes a Shaky Norm Beginning after World War I, and especially after World War II, many young people left their large kin groups on the farm and migrated to distant cities, where they established new nuclear families. Soon suburbia, with its many similar single-
This compact family type suited industry and business because it had no firm ties to other relatives and so was portable. Many North Americans born since 1950 moved as many as ten times before reaching adulthood. The grandparents, aunts, and uncles who were left behind missed helping raise the younger generation and had no one to look after them in old age. This separation of older from younger generations is one reason nursing homes for the elderly proliferated.
In the 1970s, the nuclear family encountered challenges from many areas, including changing gender roles. Suburban sprawl meant onerous commutes to jobs for men and long, lonely days at home for women. Women began to want their own careers, and rising consumption patterns made their incomes increasingly useful to family economies. By the 1980s, seventy percent of working-
Once employed, however, a woman could not easily move to a new job location if she had an upwardly mobile husband. Also, working women could not manage all of the family’s housework and child care, as well as a job. Some married men began to handle part of the household management and child care, but the demand for commercial child care grew sharply. With family no longer around to strengthen the marital bond and help with child care, and with the new possibility women in unhappy marriages had of being able to financially support themselves, divorce rates rose into the mid-
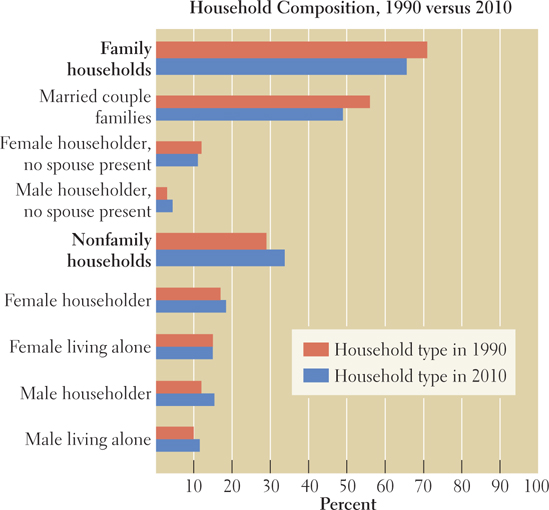
The Current Diversity of American Family Types There is no longer a typical American household, only an increasing diversity of household forms and ways of family life (Figure 2.35). In 1960, the nuclear family—
While most of these families function well, a few of these new forms may not provide adequately for the welfare of children. In 2006, more than 29 percent of U.S. children lived in single-
Children and Poverty in North America Single-
THINGS TO REMEMBER
North America has some of the world’s wealthiest cities, most of which are in the eastern United States. Nearly 80 percent of North Americans now live in metropolitan areas.
A steady increase in migration from Middle and South America and parts of Asia promises to make North America a region where most people are of non-
European descent. Statistics on access to health care, education, and financial services by race and ethnicity show that, on average, Americans have quite uneven experiences based on their racial and ethnic characteristics.
There is no longer a typical American household, only an increasing diversity of household forms.
A large percentage of children in the United States live in poverty, compared to other developed countries.