Although extinction is a natural process, its current rate is unprecedented
The current number of species on Earth is difficult to estimate. We do know that 1.3 million species have received Latin names and about 15,000 new species are described each year. While estimates for the total number of species range from 3 to 100 million, depending on the assumptions used, most scientists agree that there are about 10 million species. Some species are declining in abundance and facing extinction as humans continue to alter terrestrial and aquatic ecosystems. However, as we have seen throughout this book, some extinctions are natural. Therefore, we need to understand the historic versus modern rates of extinctions. In this section, we will explore the past and present rates of extinction and then examine how specific groups of organisms are faring. As part of this discussion, we will consider both declines in species diversity and declines in genetic diversity.
545
Background Extinction Rates
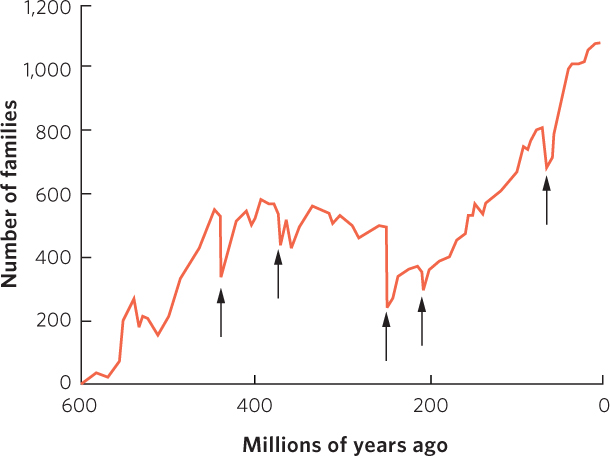
Over the past 500 million years, the world has experienced five mass extinction events, which are defined as events in which at least 75 percent of the existing species go extinct within a 2-million-year period. During these events, large numbers of species, genera, and families around the world went extinct, as illustrated in Figure 23.3. In each of these events, the extinctions were not instantaneous but rather occurred over periods of about 2 million years. During the first mass extinction, about 443 Mya, most species lived in the oceans. An ice age caused sea levels to drop and the ocean chemistry to change, which resulted in 86 percent of species going extinct. The second mass extinction happened 359 Mya when much of the ocean lacked oxygen—for reasons that are unclear—and 75 percent of all species went extinct. During the third mass extinction—248 Mya— an astounding 96 percent of all species then present on Earth went extinct. Although researchers have constructed multiple hypotheses to explain this third mass extinction, we are still uncertain about the cause. The fourth mass extinction, which occurred 200 Mya, caused 80 percent of the world’s species to go extinct. Hypotheses for the causes of this fourth extinction include increased volcanic activity, asteroid collisions with Earth, and climate change.
Mass extinction events Events in which at least 75 percent of the existing species go extinct within a 2-million-year period.
The best-known mass extinction is the fifth, which happened 65 Mya and included the extinction of the dinosaurs. This event is attributed to several factors. First, volcanic eruptions and changes in climate caused long periods of cold weather. This was followed by a massive asteroid that struck the Yucatan Peninsula in Mexico. The asteroid is estimated to have been 10 km wide and struck with a force more than 1 billion times that of the atom bomb dropped on Hiroshima during World War II. The explosion created a massive, 180-km-wide crater. Scientists hypothesize that the explosion put so much dust into the atmosphere that it blocked the Sun’s rays, making Earth much less hospitable to dinosaurs along with many other groups such as flowering plants. During this time, 76 percent of the species on Earth went extinct.
As you can see from this history of natural mass extinction events, only a small percentage of all species that ever lived on Earth are present today. In fact, over the past 3.5 billion years, it is estimated that 4 billion species have existed on Earth and 99 percent of these species are now extinct. However, as you can see in Figure 23.3, after each mass extinction event, new species evolved and, overall, the number of species has increased with time.
A Possible Sixth Mass Extinction
We have seen that a mass extinction is defined as the extinction of 75 percent of species within a 2-million-year period. Many scientists have hypothesized that the increase in the human population during the past 10,000 years may have initiated a sixth mass extinction event. To evaluate this hypothesis, we need to quantify the rates of extinction during the first five mass extinctions and then compare them with the current rate of extinction. Researchers have addressed this question by looking at groups of organisms, such as mammals, for which there are very good fossil data on extinctions. When researchers compare the extinction rate for mammals during the most recent 500 years to the rate of mammal extinctions over 500-year intervals in the past, they find that the current extinction rate exceeds the historic extinction rate. In fact, the United Nations Convention on Biological Diversity estimates that the extinction rate during the last 50 years has been as much as 1,000 times higher than the historic rate. Should this rate continue for hundreds or thousands of years, it could qualify as a mass extinction event.
Global Declines in Species Diversity
When we think about the decline in the world’s biodiversity, we often focus on the last few centuries, from the Industrial Revolution to today—a time in which we have drastically altered our world. However, human impacts on biodiversity can be seen much farther back in time. For example, researchers in 2009 examined the diversity of North American mammals from 30 million years ago to 500 years ago. This span of time is interesting because humans arrived in North America from Asia approximately 10,000 years ago.
546
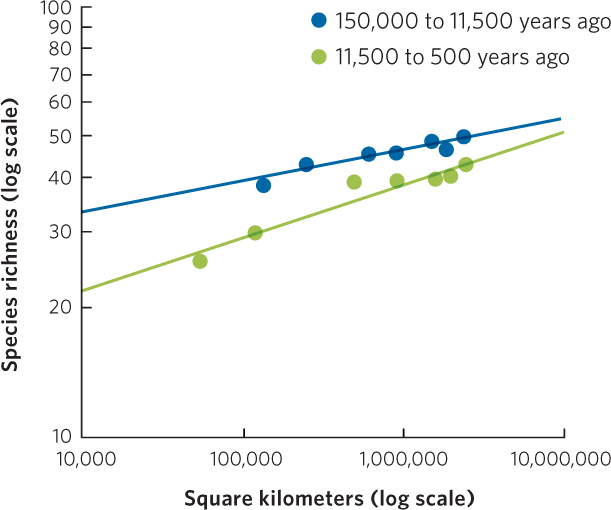
Based on a rich fossil history of mammals, the researchers defined different geographic regions of North America and determined the number of fossil species in each region. With these data they created species–area curves for different time periods in North America. Compared to the period before the arrival of humans—150,000 to 11,500 years ago—the species–area curve for the period after human arrival—11,500 to 500 years ago—was significantly lower, as you can see in Figure 23.4. Simply put, the arrival of humans coincided with a 15 to 42 percent decline in mammal diversity, depending on the geographic region examined. The losses include 56 species and 27 genera of large mammals, including horses, a giant ground sloth, camels, elephants, the saber-toothed tiger, and a species of lion.
Explanations for these extinctions include rapid climate change following the retreat of the glaciers, hunting pressure from the human population, and epidemic diseases carried from Asia by domesticated animals. Many scientists hypothesize that most of the large mammals were driven extinct by humans who hunted them. We know that the diversity of mammal species had been substantially reduced during the period of human occupation of North America prior to the Industrial Revolution although we can’t be sure of the reason. Any current impacts are adding to previous extinctions.
Whether the world’s current extinction rate of species will approach the magnitude of a mass extinction depends on how many of the species currently on Earth go extinct during the next few centuries. To assess how different groups of organisms are currently faring, the International Union for Conservation of Nature (IUCN) has defined categories that describe whether a species is persisting well, declining, or extinct. Extinct describes a situation in which a species was known to be in the wild in the year 1500 but no individuals remain alive today. Extinct in the wild is a category used when the only individuals remaining are in captivity, such as animals living in zoos. Threatened species are those whose populations face a high risk of extinction in the future. This category includes species that are considered “endangered.” Near-threatened species are those that will likely become threatened in the future. In contrast, least-concern species are those that have abundant populations and are not likely to become threatened in the future. In some cases, the status of a species has not been determined or there are simply insufficient data to make a reliable determination.
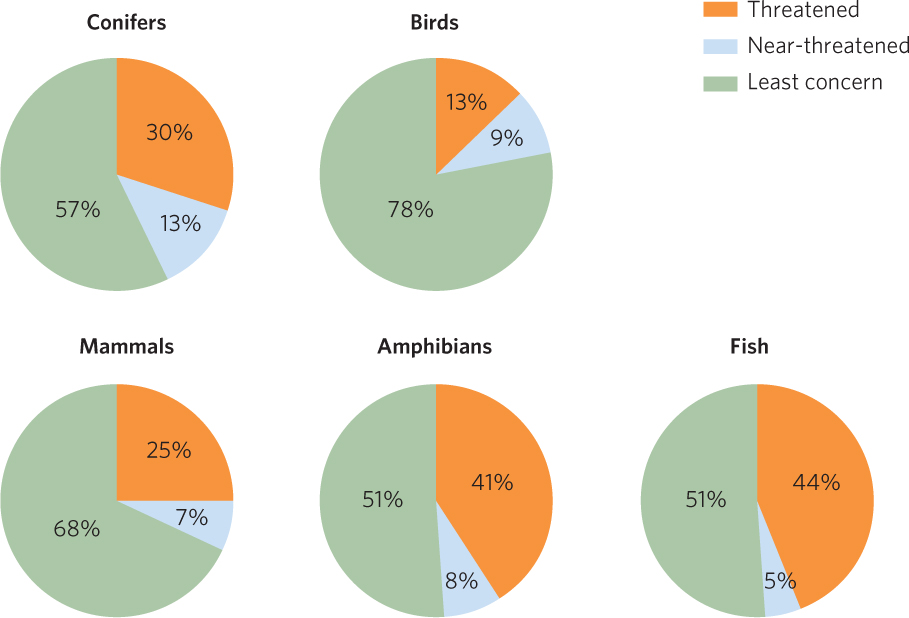
Assessing the status of species from a large taxonomic group is not easy. Groups such as birds, mammals, amphibians, and reptiles contain thousands of species and often a large percentage of them have not been studied well enough to know if a species is abundant or if it is declining. Making such a determination requires substantial time and money for each species. Currently, our best data to assess the decline in biodiversity are for conifers, birds, mammals, amphibians, and fish. Assessments for these taxonomic groups were produced by the IUCN from 2009 to 2012, and you can see a summary of these data in Figure 23.5.
Conifers
Conifers include pines, spruces, firs, cedars, and redwoods, and the survival prospects of 95 percent of these species have been assessed. This high level of assessment is possible in part because the group has a relatively low number of species and large trees and shrubs are more easily assessed for population declines. Of the 607 species of conifers, none has gone extinct. Of those species that have sufficient data for assessment, 57 percent are categorized as of least concern, 13 percent are near-threatened, and 30 percent are threatened.
Birds
Some of the best data on species assessments come from birds because they are relatively easy to monitor and they have been studied for a long time. The 2012 assessment found sufficient data for assessment of 99 percent of the more than 10,000 species of birds on Earth. Since the year 1500, 130 of these (1.3 percent) have gone extinct, including three species that went extinct since the year 2000. Of the remaining species for which there are reliable data, 78 percent have abundant populations, 9 percent are near-threatened, and 13 percent are threatened with extinction.
547
Mammals
Of the 5,490 species of mammals that have lived on Earth since the year 1500, 85 percent have sufficient data to assess their status. During the past 500 years, 78 mammal species (1.4 percent) have gone extinct. Of those remaining for which there are reliable data, researchers found that 68 percent of the species are categorized as of least concern, 7 percent are near-threatened, and 25 percent are threatened.
Amphibians
Amphibians have been particularly hard hit in recent decades from several causes that include habitat loss and the spread of the deadly chytrid fungal disease that we discussed in Chapter 15. Of the more than 6,300 species of amphibians assessed, only 75 percent contained sufficient data to assess their conservation status. Of those with sufficient data, 51 percent of the species are categorized as of least concern, 8 percent are near-threatened, and a staggering 41 percent of amphibian species are threatened.
Because amphibians are not as visible as birds and mammals, scientists are still discovering new species at a rapid rate. For example, from 2004 to 2012, researchers discovered 1,666 new species of amphibians, which represents nearly one-fourth of the world’s described amphibian species. One challenge with so many new discoveries is that little is known about the population status of these species. Researchers expect hundreds more species to be discovered in the future and therefore our estimates of each category will continue to be updated.
Fish
Like amphibians, fish have also experienced a tremendous number of declines. The IUCN considered more than 3,000 species of fish in their most recent assessment and 431 were found to be data deficient. Of those species with reliable data, 51 percent of the species are categorized as of least concern, 5 percent are near-threatened, and 44 percent are threatened.
The data from conifers, birds, mammals, amphibians, and fish suggest that if human impacts on these species continue we should expect a large number of species extinctions in future centuries. Although our best data come from these five groups, researchers hypothesize that the patterns of decline observed in these groups are representative of many other groups for which data on the status of species are relatively poor. This prediction is supported by preliminary efforts to assess the status of other major groups. Although less than 10 percent of all species of flowering plants, reptiles, and insects have been assessed, 46 to 74 percent of the currently assessed species are categorized as threatened.
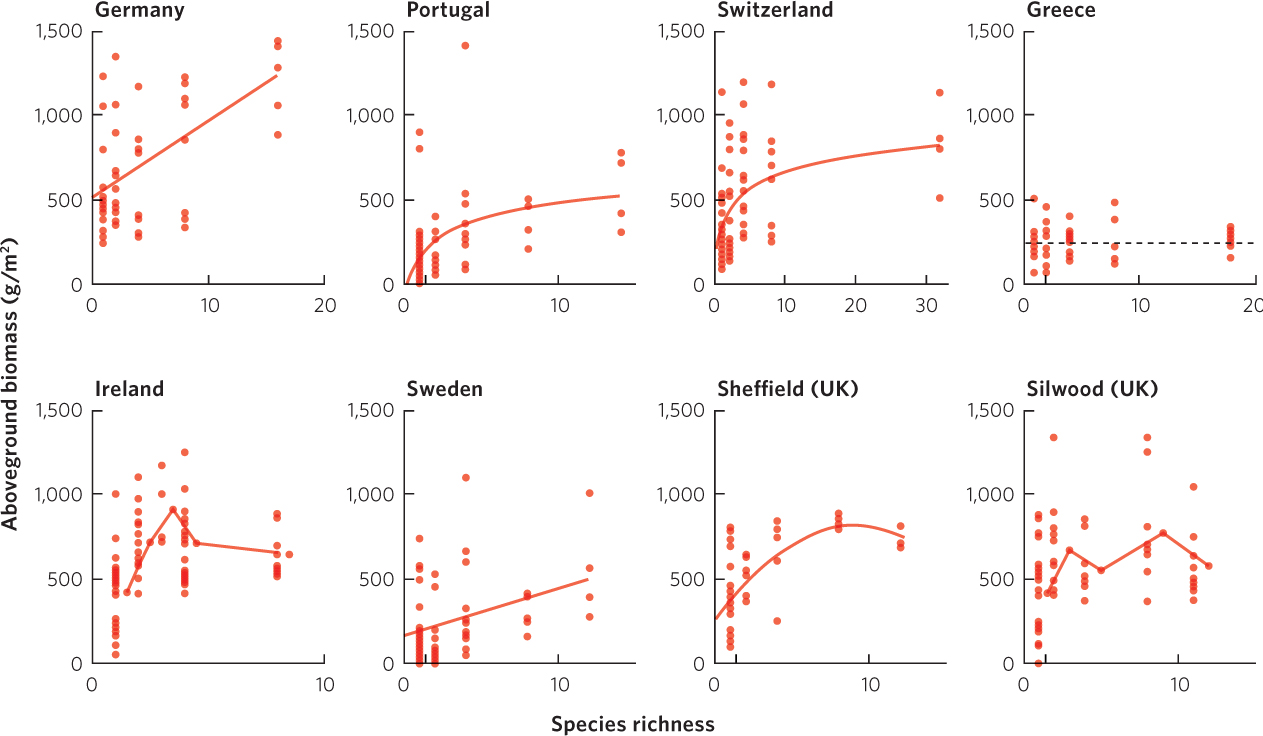
As we have discussed in previous chapters, these declines in species richness are a concern not only because of the risk of losing species but also because of the effect these declines have on communities and ecosystems. As we discussed in Chapter 17, experimental increases in the number of mycorhizal fungi cause increases in the biomass of plants (see Figure 17.22). In Chapter 18 we also observed that a decline in species richness can cause communities to be less stable over time by affecting community resistance or resilience (see Figure 18.22). Declines in species richness can also cause a decline in the functioning of ecosystems. For example, a review of all research examining patterns between experimental manipulations of plant species richness and the aboveground biomass of plants—just one measure of an ecosystem’s function— has found that there is commonly a positive relationship, although there are exceptions. You can see examples of these relationships in Figure 23.6.
548
Global Declines in Genetic Diversity
In addition to the decline in species diversity around the world, we have also seen a decline in the genetic diversity of many existing species. As we discussed in Chapter 7, causes of decline in genetic diversity include declining population sizes, inbreeding depression, and the bottleneck effect. Smaller populations do not possess the same amount of genetic diversity as large populations. These declines in genetic diversity reduce the probability that a population contains genotypes able to survive changing environmental conditions, including changes in climate and emerging infectious diseases.
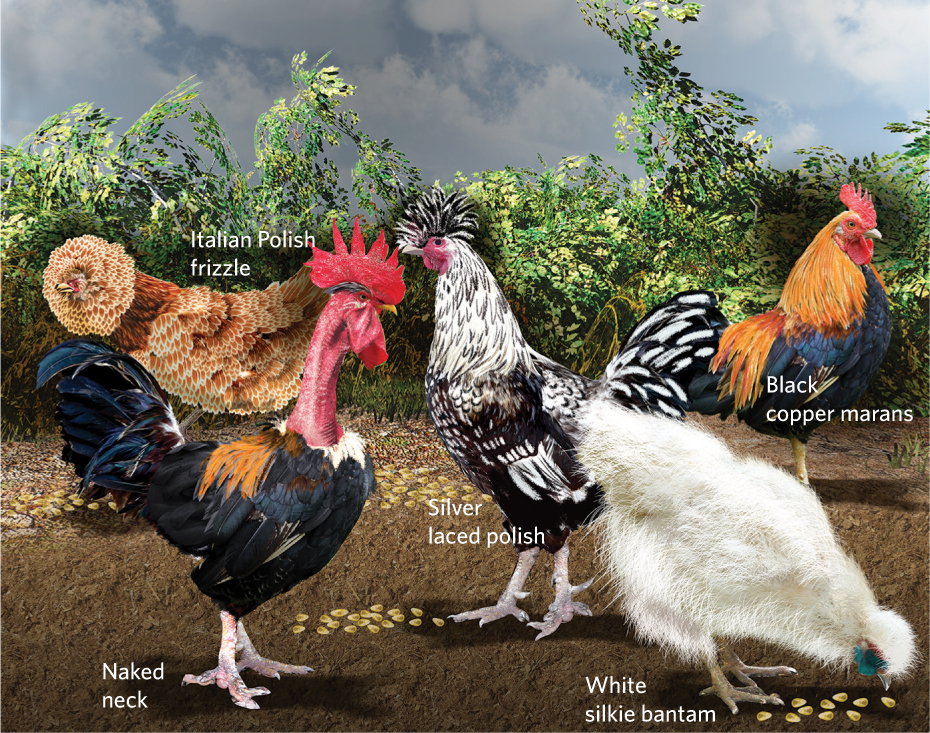
The decline in the genetic diversity of livestock and crops has a direct and immediate effect on humans. The livestock that we consume or use for labor and transportation include just seven species of mammals (cattle, pigs, sheep, goats, buffalo, horses, and donkeys) and four species of birds (chickens, turkeys, ducks, and geese). Humans have bred these species for a wide variety of different traits including size, strength, quality of meat, and ability to persist under challenging environmental conditions such as drought and diseases (Figure 23.7).
During the past century, many livestock varieties have not been maintained because larger, modern livestock operations favor a relatively few breeds. In Europe, for instance, about half of the livestock breeds present in 1900 are now extinct. Of those breeds remaining, 43 percent are at a serious risk of extinction. In North America, 80 percent of the livestock breeds that have been evaluated are either declining in abundance or facing extinction. Around the world, of the 7,000 breeds of 35 domesticated species of birds and mammals, more than 10 percent are already extinct and another 21 percent are at risk of extinction. Such a rapid decline in genetic diversity means there is considerably less diversity to draw from should we need to breed domesticated animals that can live in new locations or in changing environments, or that can withstand new diseases. Simply put, reduced genetic variation reduces our future options.
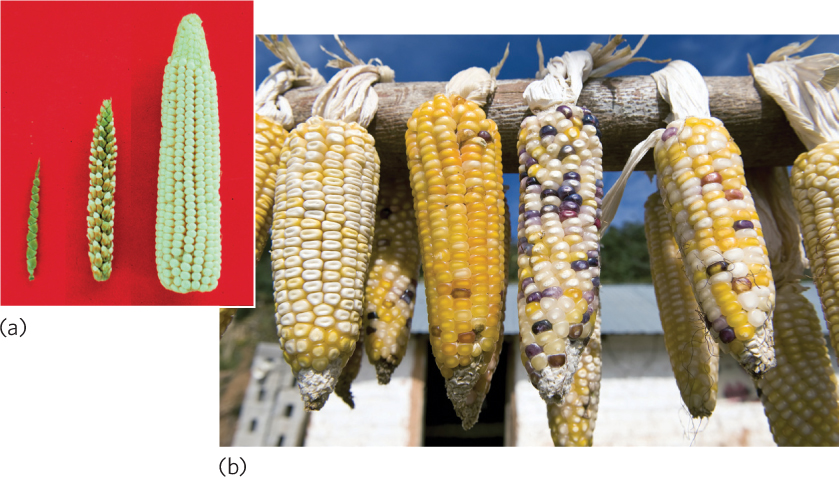
Declines in genetic diversity are also occurring in plant species that are important to humans. Humans historically consumed more than 7,000 species of plants, but today consume only about 150 species. Moreover, just 12 species of plants make up the vast majority of people’s diets; among these are wheat, rice, and corn. In some cases—for example, corn— modern varieties look very different from their ancestors (Figure 23.8). In earlier times, humans bred varieties that grew well under particular local environmental conditions. However, as agricultural practices changed, irrigation and fertilizer made it possible to reduce the harshness of the growing environment and small farms gave way to much larger operations that favored only the top-producing varieties. As a result, many of the older, local varieties of crops are no longer available. For example, U.S. farmers grew about 8,000 varieties of apples in 1900 but today, 95 percent of these varieties are extinct. Similarly, 80 percent of the corn varieties that existed in Mexico in 1930 and 90 percent of the wheat varieties that existed in China in 1949 are now gone.
549
Losing the genetic diversity of these crops reduces our options when we need to respond to challenges such as new pathogens that attack a crop. For example, in the 1970s a fungus attacked corn fields in the southern United States and was able to kill half the corn crop because the plants all came from a single variety. Fortunately, another variety of corn possessed a fungus-resistant gene and breeders were able to produce a new variety that is resistant to the fungus.
550
To protect the genetic diversity of plant varieties, many countries have been archiving seed varieties of different crop species in thousands of storage facilities around the world. Concern that such facilities could be destroyed by natural disasters or war led to the construction of the Svalbard Global Seed Vault. Located on an island in the Arctic region north of the Norwegian mainland, the facility is a 125-m tunnel built into a mountain with rooms for seeds on each side of the tunnel, as illustrated in Figure 23.9. This facility protects seeds from virtually all catastrophes. The vault has a total capacity of 1.5 million samples; as of 2013, the facility contained more than 700,000 samples of crop seeds from nearly every country. The Svalbard Global Seed Vault and many other seed storage facilities around the world preserve the ability to call upon the genetic diversity of plant species far into the future.