Terrestrial biomes are categorized by their major plant growth forms
Successful survival strategies vary with climate. In the world’s deserts, for example, we find plants that are well adapted to scarce water availability. In North American deserts, many species of cacti have thick, waxy outer layers covered with hairs and spines to help reduce water loss. In Africa, we find a group of plants called euphorbs that are not closely related to the cacti of North America yet have many similar features (Figure 6.1). Though the two groups of desert-adapted plants are descended from unrelated ancestors, they look similar because they have evolved under similar selective forces, a phenomenon known as convergent evolution. Convergent evolution can be observed in many organisms. For example, sharks and dolphins are not closely related to each other—one is a fish and the other is a mammal—yet both have evolved fins, powerful tails, and streamlined bodies. To perform well in an aquatic environment, natural selection has favored this set of traits because it allows both groups of animals to swim rapidly.
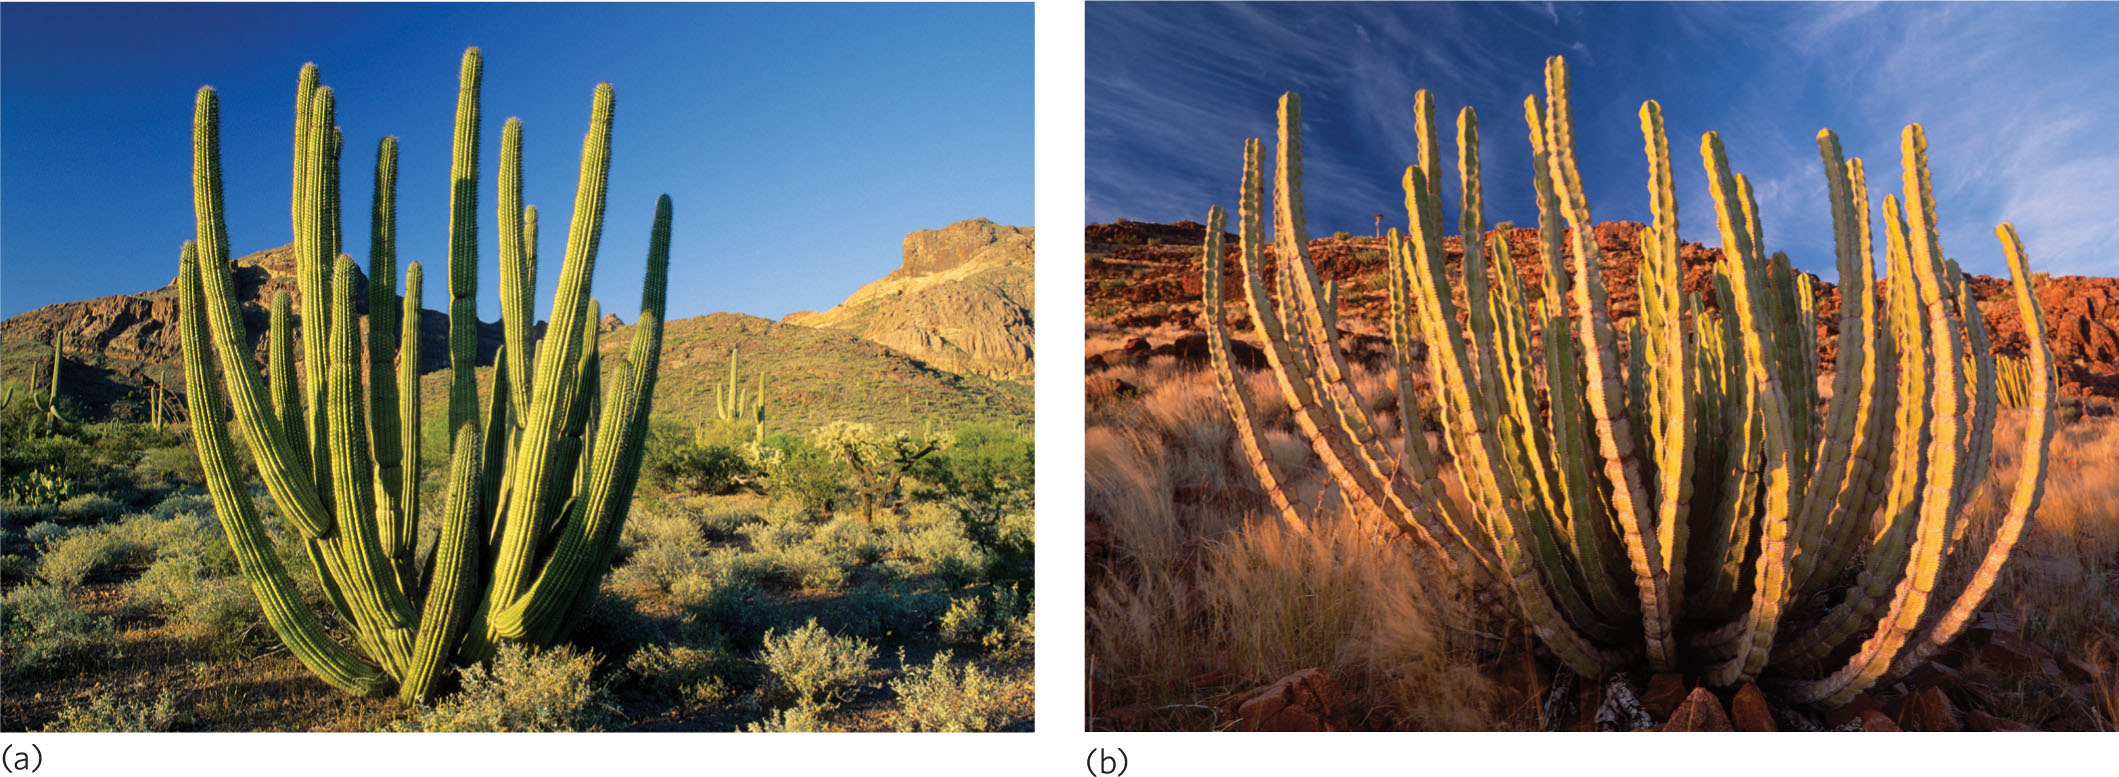
Convergent evolution A phenomenon in which two species descended from unrelated ancestors look similar because they have evolved under similar selective forces.
Convergent evolution explains why we can recognize an association between the forms of organisms and the environments in which they live. Trees found in tropical rainforests have the same general appearance no matter where they are located on Earth or their evolutionary lineage. The same can be said of shrubs inhabiting seasonally dry environments; they tend to have small, deciduous leaves and often arm their stems with spines to discourage herbivores from eating them.
Biome A geographic region that contains communities composed of organisms with similar adaptations.
Geographic regions that contain communities composed of organisms with similar adaptations are called biomes. Because of convergent evolution we can categorize terrestrial ecosystems by dominant plant forms that are associated with distinct patterns of seasonal temperatures and precipitation. In aquatic ecosystems, the major producers are often not plants but algae. As a result, aquatic biomes are not easily characterized by the dominant growth forms of the producers. Instead, aquatic biomes are characterized by distinct patterns of depth, flow, and salinity.
Biomes provide convenient reference points for comparing ecological processes around the globe, which makes the biome concept a useful tool that enables ecologists to understand the structure and functioning of large ecological systems. As in all classification systems, exceptions occur. Boundaries between biomes can be unclear and not all plant growth forms correspond to climate in the same way. Australian eucalyptus trees, for example, form forests under climatic conditions that support only scrubland or grassland on other continents. Finally, plant communities reflect factors other than temperature and rainfall. Topography, soils, fire, seasonal variations in climate, and herbivory can all affect plant communities.
139
The overview of the major terrestrial biomes in this chapter emphasizes the distinguishing features of the physical environment and how these features are reflected in the form of the dominant plants. As a final note, although ecologists use plant forms to categorize biomes, there is generally a good association between the plant forms in a biome and the animal forms that live there. For example, deserts contain plants that are adapted to dry conditions and animals that are adapted to dry conditions.
We will use a classification system that recognizes nine major terrestrial biomes, which are listed in Figure 6.2. If we consider all combinations of average annual temperatures and average annual precipitation, as shown in the figure, we see that most places on Earth are located inside a triangular area with corners representing warm moist, warm dry, and cool dry climates. Cold regions with high rainfall are rare because water does not evaporate rapidly at low temperatures and because the atmosphere in cold regions holds little water vapor.
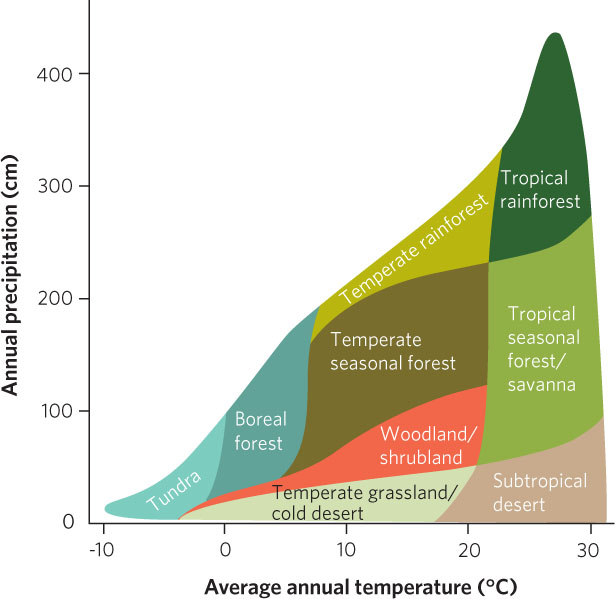
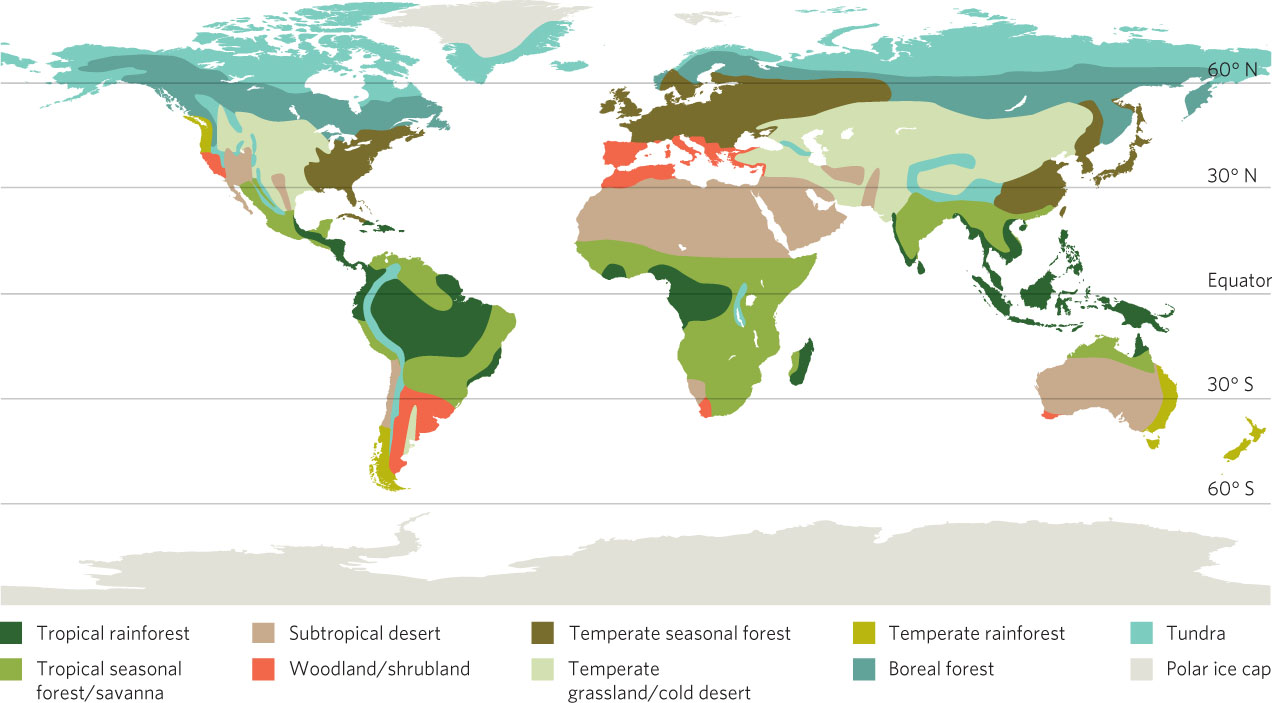
The nine biomes fall within three temperature ranges that we refer to often throughout this book. Boreal forest and tundra biomes have average annual temperatures that are below 5°C. Temperate biomes—temperate rainforest, temperate seasonal forest, woodland/shrubland, and temperate grassland/cold desert—are a bit warmer, with average annual temperatures between 5°C and 20°C. Finally, tropical biomes—tropical rainforest, tropical seasonal forest/savanna, and subtropical desert—are the warmest biomes, with average annual temperatures greater than 20°C. The global distribution of these biomes is illustrated in Figure 6.3. As we will see, the average annual precipitation within each of these temperature categories can vary widely.
140
Climate Diagrams
Climate diagram A graph that plots the average monthly temperature and precipitation of a specific location on Earth.
To visualize the patterns of temperature and precipitation that are associated with particular biomes, scientists use climate diagrams, which are graphs that plot the average monthly temperature and precipitation of a specific location on Earth.
Figure 6.4 provides two sample climate diagrams. As you can see, the shaded area on the X-axis indicates the months in which the average temperature exceeds 0°C. These months are warm enough to allow plant growth and therefore represent the growing season of the biome. Climate diagrams can also indicate whether plant growth is more limited by temperature or by precipitation. For every 10°C increase in temperature, plants require an additional 2 cm of monthly precipitation to meet the increased water needs that occur under warmer temperatures. Climate diagrams set temperature and precipitation axes so that every 10°C increase in average monthly temperature corresponds to a 2 cm increase in monthly precipitation. This means that in any month in which the precipitation line goes below the temperature line, plant growth is constrained by a lack of sufficient precipitation. In contrast, any month in which the temperature line goes below the precipitation line, plant growth is constrained by a lack of sufficient temperature. Since climate is the primary force determining the plant forms of the nine different biomes, locations around the world that are from a particular biome have similar climate diagrams.
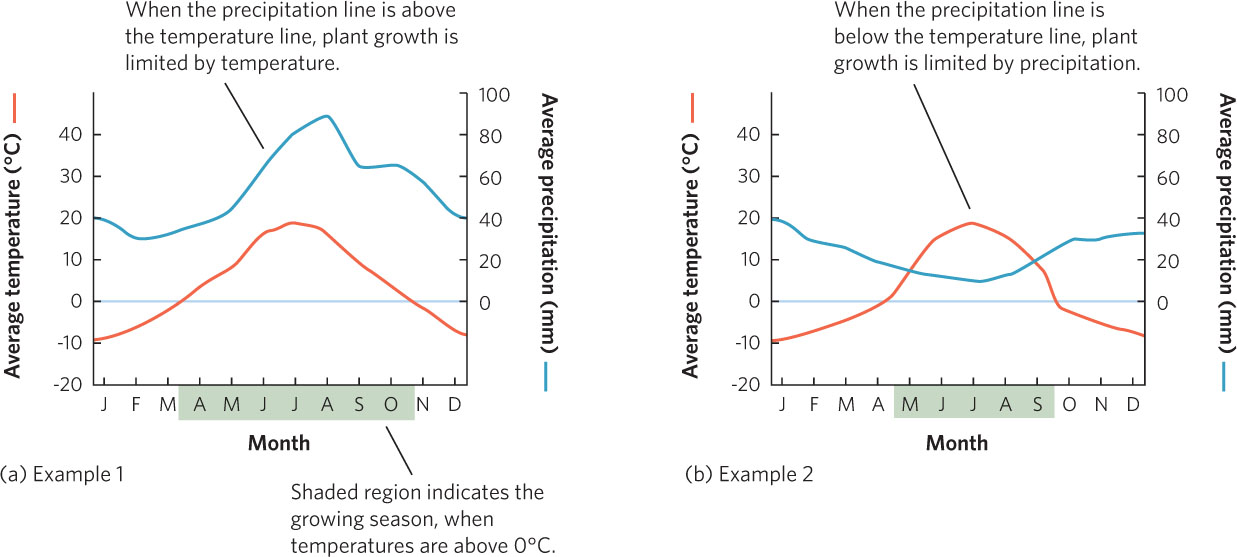
Growing season The months in a location that are warm enough to allow plant growth.
141
ANALYZING ECOLOGY
Mean, Median, and Mode
Climate diagrams are a useful way of conveying a good deal of information about the average monthly changes in temperature and precipitation. While the climate of a particular location can vary from year to year, the climate diagrams display the typical conditions based on several years of collecting data. Using these data, one can then determine the mean temperature and precipitation for a particular month. The mean, or average, is calculated by summing all of the data and dividing by the total number of data points. The mean value gives you a sense of where the middle value lies in a set of data. However, this assumes that the data have a symmetrical distribution such that half of the values fall above the mean and half of the values fall below the mean.
In some sets of data, the values are not symmetrically distributed around a middle value. In such cases, a better estimate of the middle value is the median. The median is found by placing the data in order, from lowest to highest, and finding the number that occurs in the middle. If there is an even number of values, then there are two numbers in the middle and the median is found by taking the average of these two middle numbers. For example, consider the values:
95, 93, 90, 85, 81, 75, 63, 42, 21;
the mean = (95 + 93 + 90 + 85 + 81 + 75 + 63 + 42 + 21) ÷ 9 = 71.7;
in contrast, the median = 81.
For a set of data that contains an even number of values, the median is calculated as the mean of the middle two values. For example, consider the following values:
95, 93, 90, 85, 81, 79, 75, 63, 42, 21.
In this case, there is an even number of values and two numbers, 79 and 81, are the middle values. As a result, the median is the average of these two numbers = 80.
Sometimes scientists are not as interested in the mean or median from a set of data, but rather want to know which values occur most frequently. In this case, they determine how often each value occurs; the mode is the value that occurs most frequently. For example, consider the following values:
95, 93, 90, 85, 81, 81, 75, 63, 42, 21.
In this list, 81 appears more frequently than the other values, so the mode is 81. Generally, the mode is useful only for large samples where sampling of each possible value is reasonably good.
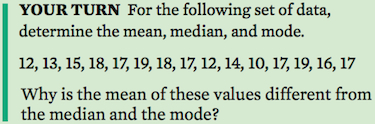
Mean = 15.6
Median = 17
Mode = 17
The values differ because the mean measures the central tendency of the data by calculating the average value while the median ranks the data and uses the middle data point; the mode uses the commonly occurring value.
Let’s take a closer look at the nine terrestrial biomes and their associated climate diagrams.