CITY MOUSE, COUNTRY MOUSE
Fifteen miles north of Manhattan, on farms and apple orchards tucked away in the New York countryside, white-footed mice lead slower-paced lives, free from the stresses of urban living.
Have city mice and country mice evolved differently as a result of living in different environments? To answer this question, Munshi-South and a graduate student, Stephen Harris, are collecting DNA samples from country mice in order to compare the gene pools of city and country mice. “The sort of low-hanging fruit that we hope to find are the genes that are consistently different between urban and rural populations,” says Munshi-South.
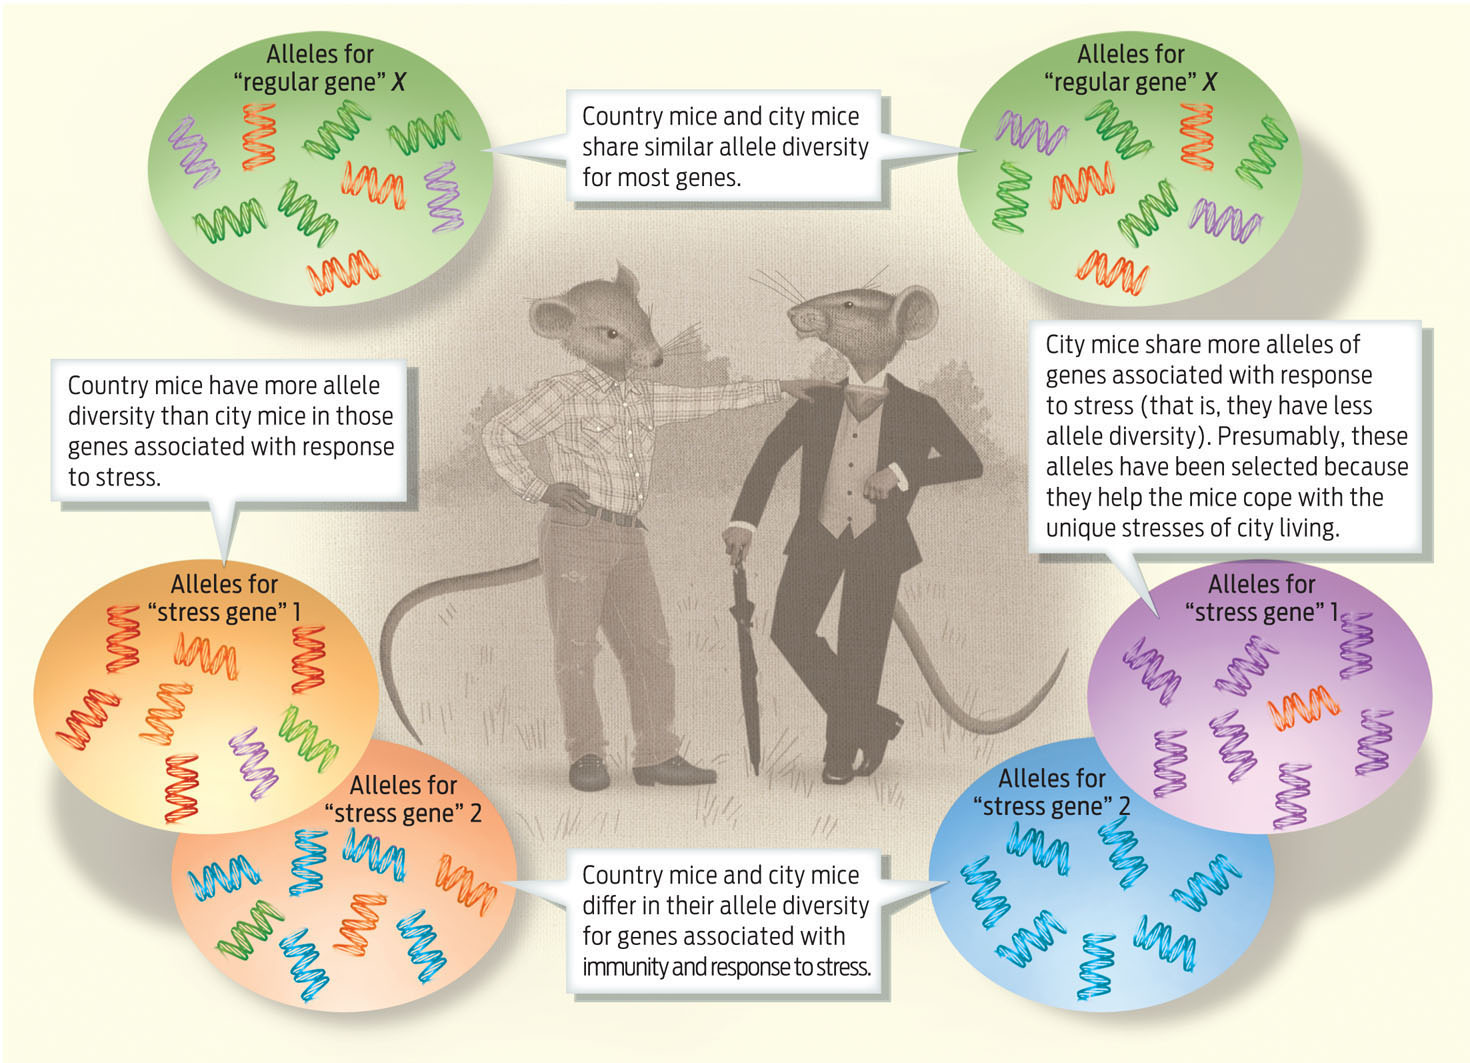
They’ve only just begun this work, but already they are finding some interesting results. A number of genes do seem to differ consistently between urban and rural populations. Perhaps not surprisingly, they have to do with things like immunity and response to stress. There are basically two types of stress that city mice face, says Munshi-South: stress associated with pollution, such as higher levels of heavy metals in the water and soil, and stress associated with living in crowded quarters and having to compete with lots of other mice for food and sex.
City mice have higher frequencies of certain “stress alleles” than do country mice, which makes perfect sense, he says. The city mice and the country mice have experienced different selective pressures, and these selective pressures have led to differences in the gene pools of these two large populations. Overall, city mice seem a bit better able to cope with these pressures than their country mouse cousins; they are New Yorkers born and bred (INFOGRAPHIC 15.5).
Country mice and urban mice differ most often in genes associated with immunity and response to stress. These genes may be responding to selective pressures in the urban environment, such as exposure to pollution and competition for food and mates.

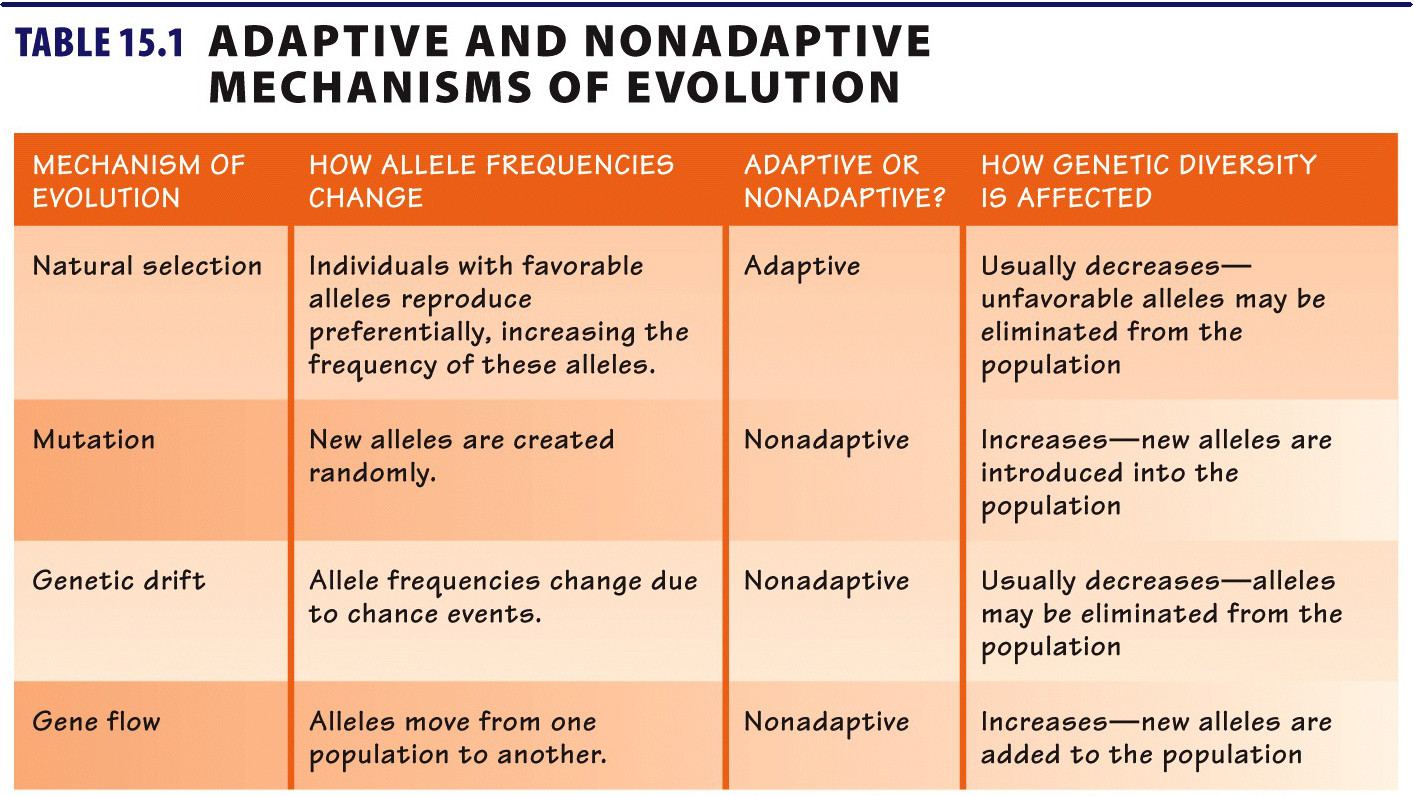
While city mice have experienced selection for urban traits, this does not mean they are all the same. Many genetic differences still exist among the local populations of urbanized mice. That’s because mutation, drift, and gene flow continue to occur even as natural selection is happening. In fact, for most natural populations, all four mechanisms of evolution—selection, mutation, gene flow, and genetic drift—are continually operating at the same time, fostering unique evolutionary outcomes (TABLE 15.1) .

HARDY-WEINBERG EQUILIBRIUM The principle that, in a nonevolving population, both allele and genotype frequencies remain constant from one generation to the next.
HARDY-EQUATION WEINBERG A mathematical formula that calculates the frequency of genotypes and phenotypes one would expect to find in a nonevolving population.
How do biologists identify genes that have changed because of evolutionary mechanisms? To answer this question, it helps to know how alleles behave in a nonevolving population. Allele frequencies in a nonevolving population behave in a predictable way: by definition, they do not change over time. Furthermore, in a nonevolving population, genotype frequencies remain unchanged from one generation to the next, a condition known as Hardy-Weinberg equilibrium. By describing the default pattern of how alleles behave from one generation to the next when evolution is not occurring, the Hardy-Weinberg equilibrium provides a baseline from which to judge if a population is evolving. (Scientists call this a null hypothesis.)
The Hardy-Weinberg equation is a mathematical formula that relates allele frequencies to genotype frequencies in a population at Hardy-Weinberg equilibrium. If, using this equation, we find that the actual genotype frequencies are different from the expected frequencies, then we know that evolution has occurred (see UP CLOSE: CALCULATING HARDY-WEINBERG EQUILIBRIUM).
UP CLOSE CALCULATING THE HARDY-WEINBERG EQUILIBRIUM
How do we know if a population is evolving? To find out, we use a mathematical formula called the Hardy-Weinberg equation, which calculates the frequency of genotypes you would expect to find in a nonevolving population from simple rules of probability. For a gene with two alleles, B and b, with allele frequencies p and q, this formula can be written as:

By definition, a population is not evolving (and is therefore in Hardy-Weinberg equilibrium) when it has stable allele frequencies and stable genotype frequencies from generation to generation. This can be achieved only when all five of the following conditions are met:
- No mutation introducing new alleles into the population
- No natural selection favoring some alleles over others
- An infinitely large population size (and therefore no genetic drift)
- No gene flow between populations
- Random mating of individuals
In nature, no population can ever be in strict Hardy-Weinberg equilibrium, since it will never meet all five conditions. For example, because no real population is infinitely large, genetic drift will always occur. In other words, all natural populations are evolving. Nevertheless, by describing the pattern of genotypes in a nonevolving population, Hardy-Weinberg equilibrium provides a baseline from which to measure evolution.
To see how the Hardy-Weinberg equation can be used to detect evolutionary change, consider the following example. Say you have a population of mice with two alleles (B and b) and three possible phenotypes for fur color, gray (BB), brown (Bb), and white (bb). As every individual in the population has two alleles for the fur-color gene (one maternal and one paternal), there are twice as many alleles as there are members of the population. So a population of 500 mice has 1,000 alleles of the gene for fur color.
Now let’s say we sample the DNA of our mice population and determine that there are 800 B alleles in the population and 200 b alleles. We would then say that the frequency of the B allele is 0.8 (800/1,000) and the frequency of the b allele is 0.2 (200/1,000). Since there are only two alleles in the population, their combined frequencies will add up to 1. If we use p to denote the frequency of B and q to denote the frequency of b, then we can say that p + q = 1.
Suppose we want to use those allele frequencies to calculate the expected frequency of white-furred (bb) individuals in the population if the population is indeed in Hardy-Weinberg equilibrium. If the frequency of b in the population is q, then we know from the Hardy-Weinberg equation that the expected frequency of bb is q2 = (.2)(.2) = .04, and that this frequency will remain constant over generations. Thus, in our population of mice, 4%, or 20 mice, would be expected to have white fur, if the population is in Hardy-Weinberg equilibrium. If we find out that the actual percentage of white mice in the population is more or less than this number, then we know that our population is evolving, and we can begin to investigate why.

The Hardy-Weinberg equation also has important applications in public health. It can be used, for example, to estimate the frequency of carriers (heterozygotes) of rare recessive diseases in a population (see Question 17 in Test Your Knowledge for an example).
Hardy-Weinberg can also help researchers figure out, say, if drift or selection is operating in a given population. Let’s say biologists obtain samples of DNA from a random sampling of mice in a population and they look at the frequencies of genotypes at 10 different regions of DNA. Nine of those regions have genotype frequencies predicted by the Hardy-Weinberg equation, but one does not—it is far from Hardy-Weinberg equilibrium. Researchers then know that something interesting is happening at that one DNA location—some force of evolution is acting. In fact, this is how Munshi-South and his colleagues identified the candidate genes to compare between city and country mice.
“You can use certain deviations from Hardy-Weinberg equilibrium to find parts of the genome that are under selection,” he says. “So, if they strongly deviate from Hardy-Weinberg, whereas the rest of the genome roughly fits it, those outliers are likely to have something interesting going on, like natural selection.”
By understanding how city life has changed mice genetically, researchers will have a better understanding of how human activity is influencing mice evolution. That might not sound like a hugely important goal, especially if you’re not a fan of mice. But there are larger lessons to take away. According to Munshi-South, Manhattan offers a preview of what human activity will do to many other species in the coming years.
Manhattan offers a preview of what human activity will do to many other species in the coming years.
“Even just global warming alone is going to drive a lot of these processes in the future,” he says. Indeed, some urban animals are already feeling the heat.