10-5 The spectra of stars reveal their chemical compositions as well as surface temperatures and sizes
We have seen how careful inspection of a star’s color allows astronomers to determine its surface temperature. What happens if we look even more closely by separating starlight into its specific component colors and analyzing each of the colors present in detail?
Classifying Stars: Absorption Line Spectra and Spectral Classes
We observe an absorption line spectrum when a cool gas, lying between us and a hot, glowing object, removes particular wavelengths of light. (This idea is discussed in Chapter 2 and might be worth reviewing.) The light from the hot, glowing object itself has a continuous spectrum. In the case of a star, light with a continuous spectrum is produced at low-lying levels of the star’s atmosphere, where the gases are hot and dense. The absorption lines are created when this light flows outward through the upper layers of the star’s atmosphere. Atoms in these cooler, less dense layers absorb radiation at specific wavelengths, which depend on the specific kinds of atoms present—hydrogen, helium, or other elements—and on whether or not the atoms are ionized.
Some stars have spectra in which certain hydrogen lines are broad and obvious. But in the spectra of other stars, these hydrogen features are nearly absent and the dominant absorption lines that are obvious are the result of heavier elements such as calcium, iron, and sodium being present in the star. Still other stellar spectra are dominated by broad absorption lines caused by atoms that have combined into molecules, such as titanium oxide. To cope with this diversity, astronomers group similar-appearing stellar spectra into spectral classes. In a popular classification scheme that emerged in the late 1890s, a star was assigned a letter from A through O according to the obvious presence of particular hydrogen lines in the star’s spectrum, from greatest to least. However, nineteenth-century science could not explain why or how the spectral lines of a particular chemical are affected by the temperature and density of the gas. Since this time, many of the original A-through-O classes were dropped and others were consolidated. The remaining spectral classes were reordered in the sequence OBAFGKM. Although there are many strategies to recall this sequence that shows up again and again in this chapter, astronomy students often remember this sequence using the mnemonic “Oh, Be A Fine Girl (or Guy), Kiss Me!”
Question
ConceptCheck 10-8: What principal characteristic of a star’s spectrum most dominates which spectral class letter of the alphabet it is assigned?
Refining the Classification: Spectral Types
Although stars are nonliving objects far from Earth, astronomy is a human enterprise and its progress is highly dependent on the diversity of people pursuing the scientific questions of astronomy. Working with a team led by E. C. Pickering that included some of the most well-known early twentieth-century astronomers such as Antonia Maury and Williamina Fleming, Annie Jump Cannon refined the original OBAFGKM sequence into even smaller categories called spectral types. Each of these spectral type steps are indicated by attaching a number from 0 through 9 to the original letter. For example, the spectral class F includes spectral types F0, F1, F2,…, F8, F9, which are followed by the spectral types G0, G1, G2,…, G8, G9, and so on. This effort culminated in the Henry Draper Catalogue, published between 1918 and 1924. It listed a tremendous number of stars—225,300 stars—each of which Cannon had personally classified herself.
Figure 10-9 shows representative spectra of several spectral types. The strengths of spectral lines change gradually from one spectral type to the next. For example, certain hydrogen absorption lines become increasingly prominent as you go from spectral type B0 to A0. From A0 onward through the F and G classes, the hydrogen lines weaken and almost fade from view. The Sun, whose spectrum is dominated by calcium and iron, is a G2 star.
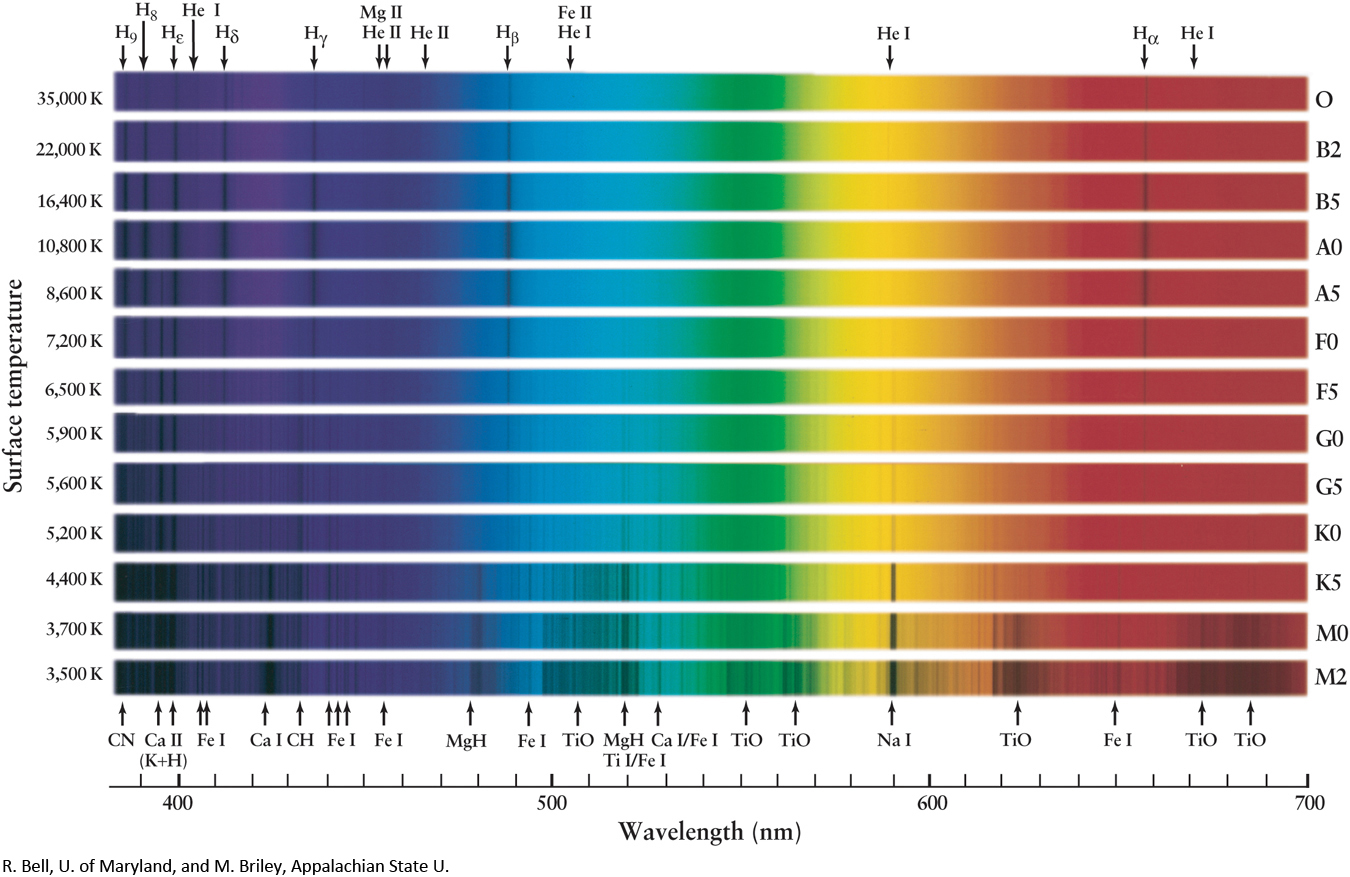
The specific spectral features seen in a star’s spectrum are highly dependent on the star’s surface temperature.
Based on new understanding of the structure of atoms and thus a new way of thinking about the nature of stars, the first tenured, female full professor at Harvard University, Cecilia Payne, working with famed Indian physicist Meghnad Saha, demonstrated in the 1920s that the OBAFGKM spectral sequence is actually a sequence in temperature. The hottest stars are O stars. Their absorption lines can occur only if these stars have enormous surface temperatures, above 25,000 K in this case. M stars are the coolest stars. (Astronomers describe stellar temperatures in terms of Kelvins rather than the more familiar Fahrenheit or Celsius scales—25,000 K is equivalent to about 45,000°F.) The spectral features of M stars are consistent with stellar surface temperatures of about 3000 K (5000°F) much cooler than the surface of our Sun. In other words, the sequence OBAFGKM is also a temperature sequence, from hottest to coldest.
236
Question
ConceptCheck 10-9: Is a spectral class F2 star more similar to an A-spectral class star or a G-spectral class star?
Question
ConceptCheck 10-10: As spectral type numbers increase within the G-spectral class of star, do the larger numbers represent higher temperature stars?
Why Surface Temperature Affects Stellar Spectra
What astronomers understand today that they did not 100 years ago is that a star’s spectrum is profoundly affected by the star’s surface temperature. Hydrogen is by far the most abundant element in the universe, accounting for about three-quarters of the mass of a typical star. Yet these hydrogen lines do not necessarily show up in all stars’ spectra. As it turns out, these absorption lines are produced when an electron in the n = 2 orbit of hydrogen is lifted into a higher orbit by absorbing a photon with the right amount of energy. If the star is much hotter than 10,000 K, about two times hotter than our Sun’s surface, the photons pouring out of the star’s interior have such high energy that they easily knock electrons out of hydrogen atoms in the star’s surrounding atmosphere. This process ionizes the gas. With its only electron torn away, a hydrogen atom cannot produce any absorption lines. Hence, these lines will be relatively weak in the spectra of such hot stars, such as the hot O and B2 stars in Figure 10-9.
237
Conversely, if the star’s atmosphere is much cooler than 10,000 K, almost all the hydrogen atoms are in the lowest (n = 1) energy state. Most of the photons passing through the star’s atmosphere possess too little energy to boost electrons up from the n = 1 to the n = 2 orbit of the hydrogen atoms. Hence, very few of these atoms will have electrons in the n = 2 orbit, and only these few can absorb these particular photons. As a result, these lines are nearly absent from the spectrum of a cool star. (You can see this in the spectra of the cool M0 and M2 stars in Figure 10-9.)
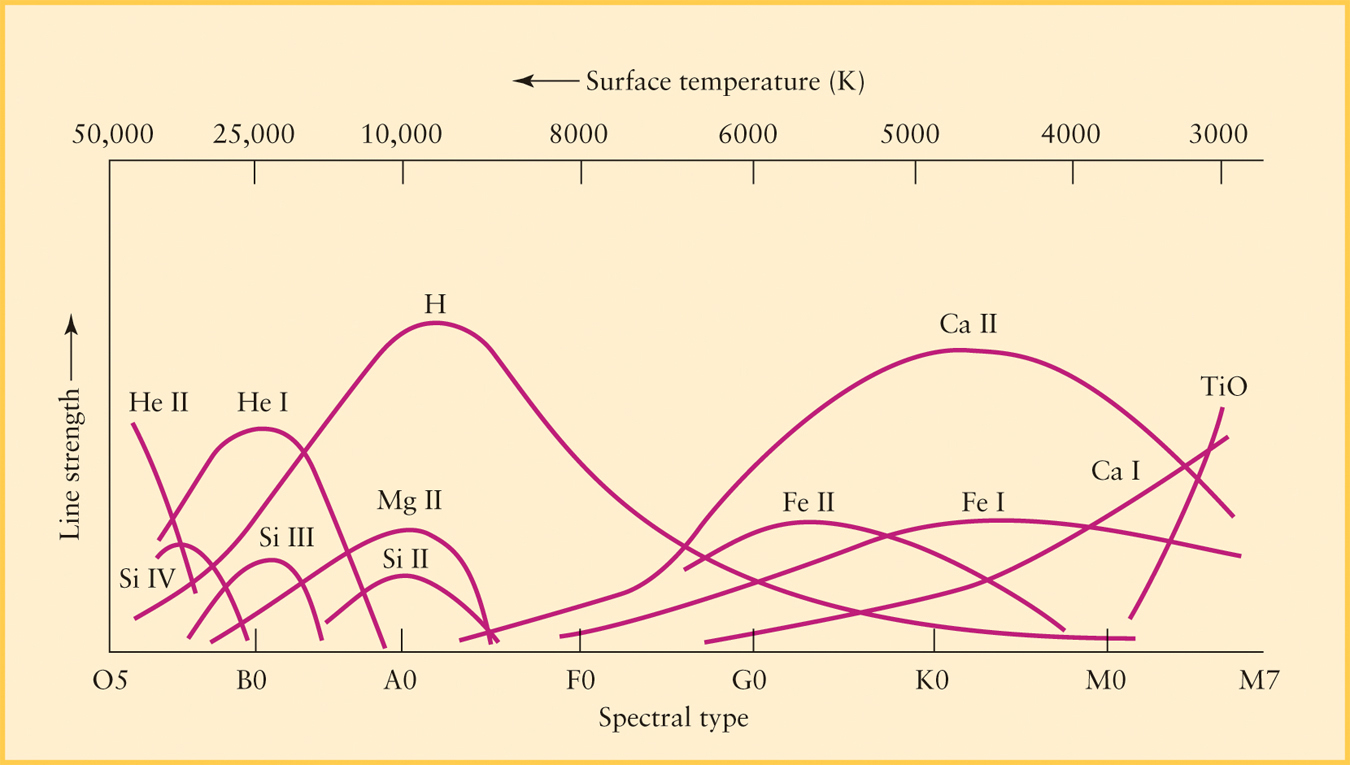
For these hydrogen lines to show up in a star’s spectrum, the star must be hot enough to excite the electrons out of the ground state but not so hot that all the hydrogen atoms become ionized. A stellar surface temperature of about 9000 K produces the strongest hydrogen lines; this is the case for the stars of spectral types A0 and A5 in Figure 10-9. Every other type of atom or molecule also has a characteristic temperature range in which it produces prominent absorption lines in the observable part of the spectrum. Figure 10-10 shows the relative strengths of absorption lines produced by different chemicals. By measuring the details of these lines in a given star’s spectrum, astronomers can accurately determine that star’s surface temperature.
Astronomers use the term metals to refer to all elements other than hydrogen and helium. (This idiosyncratic use of the term “metal” is quite different from the definition used by chemists and other scientists outside of astronomy. To a chemist, sodium and iron are metals but carbon and oxygen are not; to an astronomer, all of these substances are simply referred to as metals.) In this terminology, metals dominate the spectra of stars cooler than 10,000 K, whereas the hydrogen seemingly appears to be absent.
For very low temperature stars, with temperatures below 4000 K, certain atoms in a star’s atmosphere can combine to form molecules. (At higher temperatures atoms move so fast that when they collide, they bounce off each other rather than “sticking together” to form molecules.) As these molecules vibrate and rotate, they produce bands of spectral lines that dominate the star’s spectrum. Most noticeable are the lines of titanium oxide (TiO), which are strongest for surface temperatures of about 3000 K.
Question
ConceptCheck 10-11: If hydrogen is the most abundant atom in a star, why do the spectra of hot stars show no prominent hydrogen lines?
Spectral Classes for Brown Dwarfs
Since 1995 astronomers have found a number of tiny stars with surface temperatures even lower than those of spectral class M. By the strictest definition these are not stars, but they are not planets either. These “substars” are too small to sustain thermonuclear fusion in their cores. Instead, these objects glow primarily from the heat released as they contract. They are widely known as brown dwarfs.
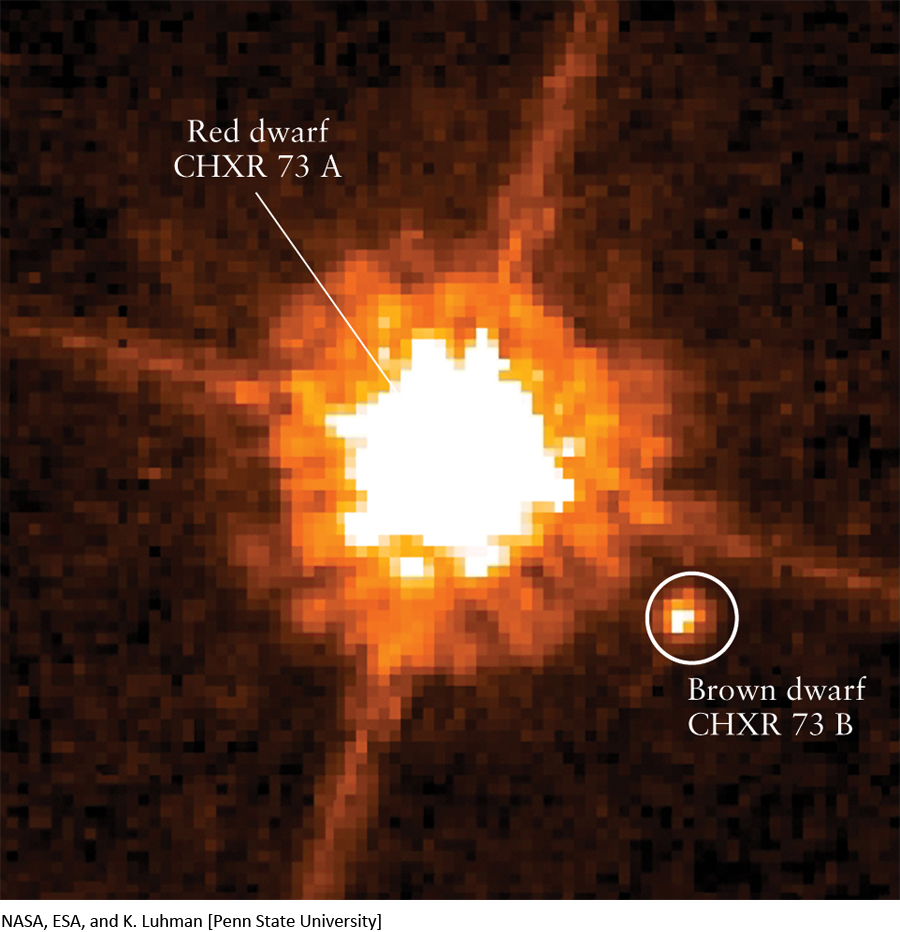
To describe brown dwarf spectra, usually observed with infrared telescopes, astronomers have defined two new spectral classes, L and T. Thus, the modern spectral sequence of stars and brown dwarfs from hottest to coldest surface temperature is OBAFGKMLT. (Can you think of a new mnemonic that includes L and T?) For example, Figure 10-11 shows a small red star of spectral class M orbited by a significantly smaller brown dwarf of spectral class T at a distance of 200 AU.
By mass, almost all stars (including the Sun) and brown dwarfs are about three-quarters hydrogen, one-quarter helium, and 1% or less metals.
We can determine the radius of a star from its luminosity and surface temperature. For a given surface temperature, the greatest luminosity will result from the largest stars.
Considering the wide range of star temperatures, astronomers are now in a position to interpret spectra in order to determine the composition of stars. As it turns out, when the effects of temperature are accounted for, astronomers find that all stars have essentially the same chemical composition. What we now understand is that by mass, almost all stars (including the Sun) and brown dwarfs are about three-quarters hydrogen, one-quarter helium, and 1% or less metals. Our Sun is about 1% metals by mass, as are most of the stars you can see with the naked eye. But some stars have an even lower percentage of metals.
238
Question
ConceptCheck 10-12: Which brown dwarf is hotter, an L or a T?
Question
ConceptCheck 10-13: If our Sun is many times hotter, many times larger, and has more active nuclear reactions than a brown dwarf does, what do they have common?