2-3 An object’s temperature is revealed by the most intense wavelength of its spectrum of light
Understanding the properties of light is the key astronomers need to unlock the mysteries of the universe. In this section, we will see how astronomers use light to measure the temperature of distant objects.
39
Infrared Light can Pass Through Interstellar Clouds that Visible Light Cannot
If light exists in a wide spectrum of forms, the question arises as to which objects actually emit light and which do not. Our eyes are sensitive to only a very small range of possible wavelengths of light, and we often do not realize that almost all objects in the universe emit light of one form or another (with the notable exception of dark matter, described elsewhere in this book), depending on how hot or cool they are.
Common objects, like your book or the shoes on your feet, are at room temperature, or about 20°C. (Ordinary room temperature is 293 K, 20°C, or 68°F; see Box 2-1 Tools of the Astronomer’s Trade: Temperatures and Temperature Scales). They are emitting some light, but most likely infrared light, which our eyes do not detect. Infrared light is the most typical wavelength of light emitted by objects at temperatures common on Earth’s surface. The reason you can read your book and see your shoes is not that they are glowing with visible light; rather, they are reflecting visible light in the room into your eyes. In other words, your book and shoes are both emitting and reflecting, but different wavelengths of light.
TOOLS OF THE ASTRONOMER’S TRADE
Temperatures and Temperature Scales
Three temperature scales are in common use. Throughout most of the world, temperatures are expressed in degrees Celsius (°C). The Celsius temperature scale is based on the behavior of water, which freezes at 0°C and boils at 100°C at sea level on Earth. This scale is named after the Swedish astronomer Anders Celsius, who proposed it in 1742.
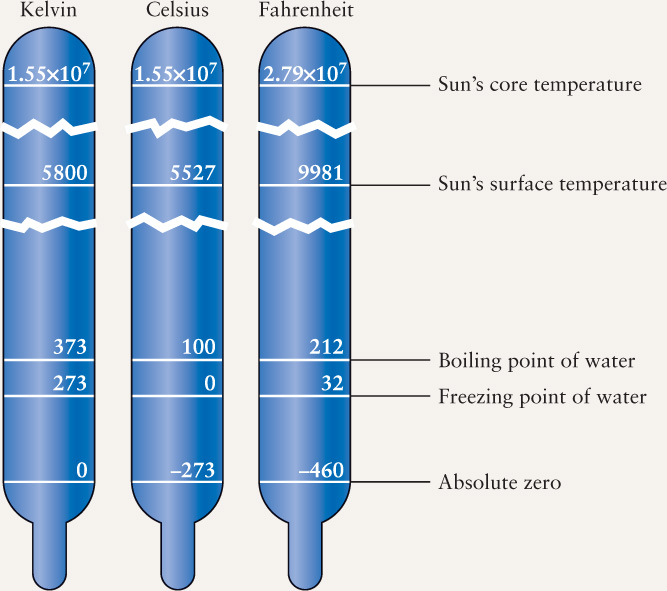
Astronomers usually prefer the Kelvin temperature scale. This is named after the nineteenth-century British physicist Lord Kelvin, who made many important contributions to our understanding of heat and temperature. Absolute zero, the temperature at which atomic motion is at the absolute minimum, is 2273°C in the Celsius scale but 0 K in the Kelvin scale. Atomic motion cannot be any less than the minimum, so nothing can be colder than 0 K; hence, there are no negative temperatures on the Kelvin scale. Note that we do not use degree (°) with the Kelvin temperature scale.
A temperature expressed in kelvins is always equal to the temperature in degrees Celsius plus 273. On the Kelvin scale, water freezes at 273 K and boils at 373 K. Water must be heated through a change of 100 K or 100°C to go from its freezing point to its boiling point. Thus, the “size” of a kelvin is the same as the “size” of a Celsius degree. When considering temperature changes, measurements in kelvins and Celsius degrees are the same. For extremely high temperatures the Kelvin and Celsius scales are essentially the same: For example, the Sun’s core temperature is either 1.55 × 10⁷ K or 1.55 × 10⁷ °C.
The now-archaic Fahrenheit scale, which expresses temperature in degrees Fahrenheit (°F), is used only in the United States. When the German physicist Gabriel Fahrenheit introduced this scale in the early 1700s, he intended 100°F to approximate the temperature of a healthy human body. On the Fahrenheit scale, water freezes at 32°F and boils at 212°F. There are 180 Fahrenheit degrees between the freezing and boiling points of water, so a degree Fahrenheit is only 100/180 = 5/9 as large as either a Celsius degree or a kelvin.
Two simple equations allow you to convert a temperature from the Celsius scale to the Fahrenheit scale and from Fahrenheit to Celsius:
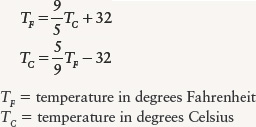
EXAMPLE: A typical room temperature is 68°F. We can convert this to the Celsius scale using the second equation:
To convert this to the Kelvin scale, we simply add 273 to the Celsius temperature. Thus,
68°F = 20°C = 293 K
Figure B2-1.1 below displays the relationships among these three temperature scales.
40
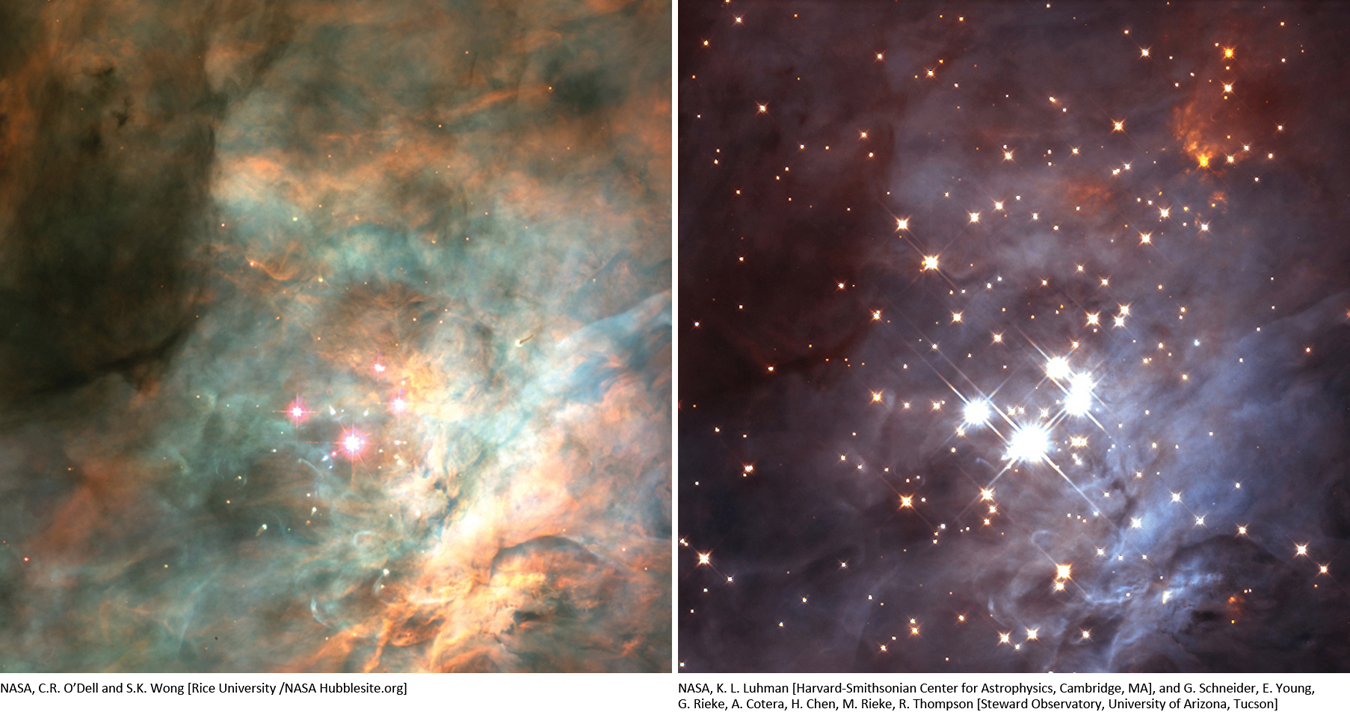
Infrared light is an important part of astronomy because infrared light can successfully pass from distant stars through interstellar clouds, which visible light cannot penetrate. A visible light camera can detect only a very few stars emitting at visible wavelengths from the Orion Nebula, whereas the camera that is sensitive to infrared light can easily see the infrared light emitted by stars within the clouds (Figure 2-7).
CAUTION
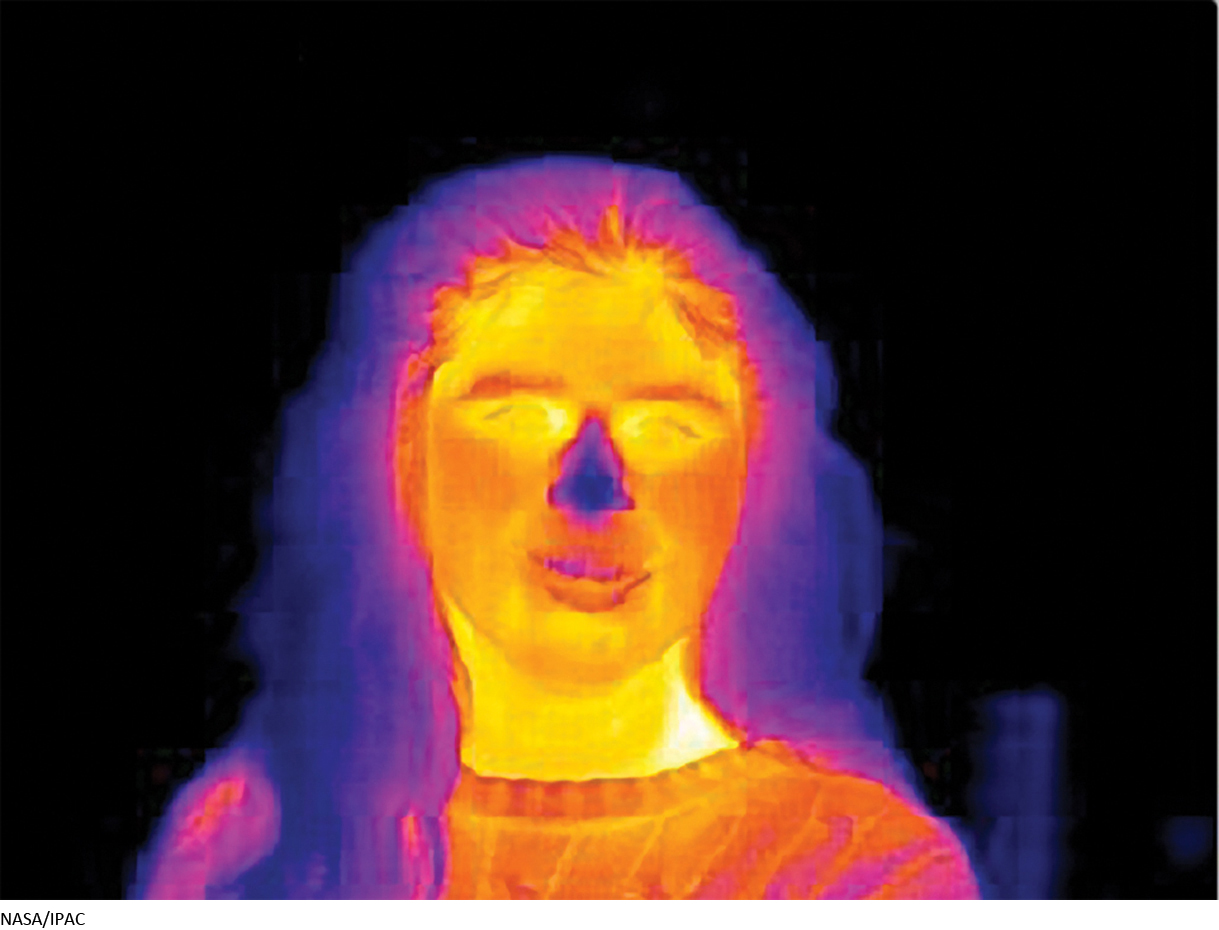
The right-hand image in Figure 2-7 is a false-color image. False-color images do not represent the true color of the stars shown. False color is often used when the image is made using wavelengths that the eye cannot detect, as with the infrared image in Figure 2-7. A different use of false color is to indicate the relative brightness of different parts of the image, as in the infrared image of a person in Figure 2-8.
Question
ConceptCheck 2-6: Which form of light is being emitted most intensely by a frozen ice cube at 0°C?
Objects Emit Specific Amounts of Light, Revealing Their Temperatures
The simplest and most common way for any object to produce more light is to increase its temperature. The hot wire inside an ordinary filament lightbulb emits light because electrical energy causes the filament to increase in temperature to thousands of degrees and glow more visibly. This relationship between an object’s temperature and the way it glows allows astronomers to determine the precise characteristics of some of the most distant objects in the universe.
Imagine a welder or blacksmith heating a bar of iron using a torch. The hottest flame glows blue, whereas the lower temperature flames glow more yellow and red-orange, as shown in Figure 2-9a–c. (You can see this same glow from the coils of a toaster, or from an electric range turned on “high.”) As the temperature drops further, more of the light given off is from longer wavelengths and appears as reddish-orange light (Figure 2-9b). If the bar could be prevented from melting and vaporizing, at extremely high temperatures it would emit a dazzling blue-white light.
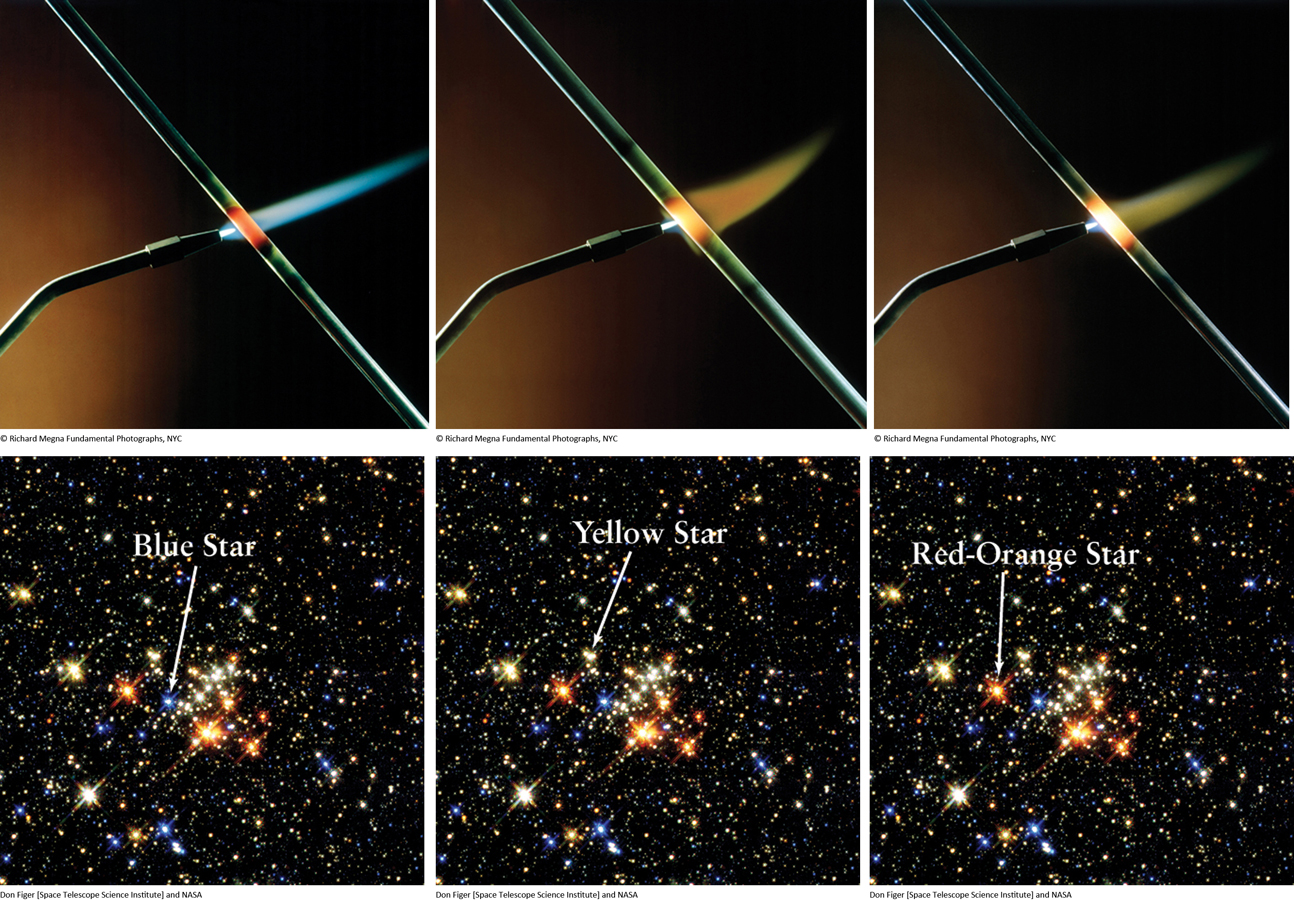
This experiment demonstrates that both the total amount of energy emitted by glowing objects and which wavelength of light is emitted most intensely depend directly on the temperature, where hotter objects emit shorter wavelength light that is more blue. The hotter the object, the brighter it is and the more energy it emits, and the shorter the wavelength at which most of the energy is emitted. Colder objects emit relatively little energy, and the wavelength of light that has the maximum intensity emitted is primarily at the longer wavelengths. But what does this tell us about the stars? If you can measure the wavelength of light most intensely emitted from a star that is far away, you can determine its temperature.
41
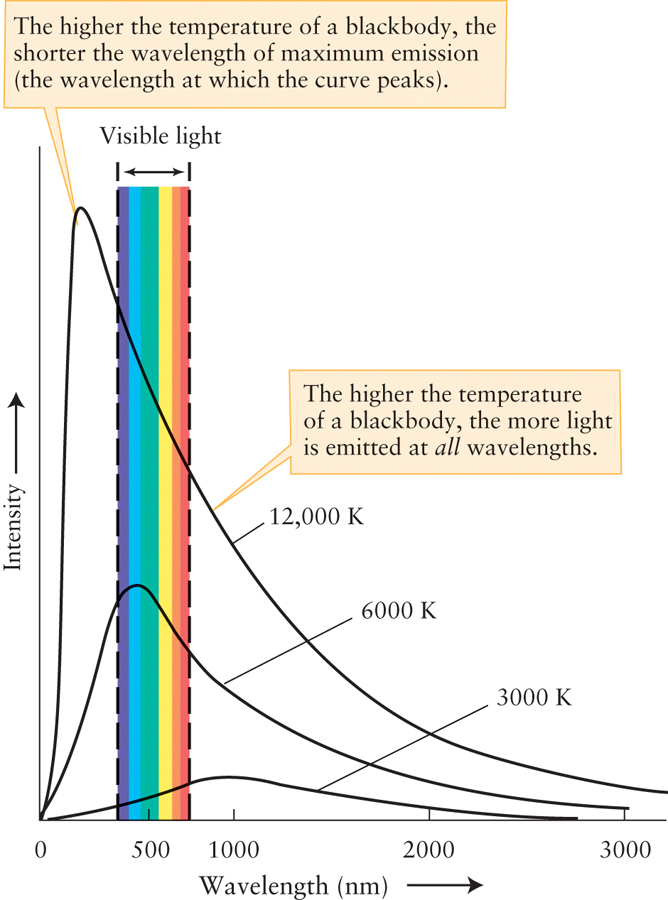
However, if all objects, including stars, emit a wide range of wavelengths of light, then how can you determine the relative amounts of different forms of light that are being emitted? One strategy is to observe glowing objects with cameras designed to detect specific wavelengths of light and then graph the intensity of light emitted at various wavelengths for an object by plotting the wavelength emitted versus the brightness. The resulting graph of this spectrum is sometimes called a blackbody curve (Figure 2-10).
CAUTION
A blackbody is an idealized example of a dense object that astronomers use as a model. A sample blackbody curve, showing brightness versus wavelength, is a graph of an object’s spectrum that illustrates the intensity of light at every wavelength emitted at a particular temperature. How might this plot be different for different objects? In our experiment “heating the bar of iron,” we noticed that as the bar increased in temperature, both its total amount of energy increased and the most intense wavelength emitted moved to shorter and bluer colors. As an object’s temperature changes, the graph of the spectrum changes accordingly. The higher the temperature, the shorter the wavelength of maximum emission (at which the curve peaks) and the greater the amount of light emitted at every wavelength (see Figure 2-10).
This inversely proportional relationship between the temperature, measured in kelvins, of an emitting object and the maximum wavelength of light emitted, measured in meters, is known most commonly as Wien’s law, after its originator, Wilhelm Wien.
42
Our observations lead to a general rule that helps us measure the temperatures of celestial objects such as planets and stars:
The higher an object’s temperature, the more intensely the object emits light and the shorter the wavelength at which it emits light most strongly.
We can express this general rule as a simple mathematical equation showing that the maximum wavelength is inversely related to the temperature.
Wien’s law for a blackbody
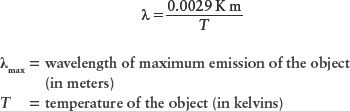
In other words, the higher the temperature, the shorter the maximum wavelength emitted. Remember that Wien’s law involves the wavelength of maximum emission in meters. If you want to convert the wavelength to nanometers, you must multiply the wavelength in meters by (109 nm)/(1 m).
The temperature of a star can be determined by measuring which color wavelength of light is being given off most intensely.
Figure 2-10 shows that for a dense object at a temperature of 3000 K, the wavelength of maximum emission is around 1000 nm (1 μm). Because this is an infrared wavelength well outside the visible range, you might think that you cannot see the light emitted from an object at this temperature. In fact, the glow from such an object is visible; the curve shows that this object emits plenty of light within the visible range, as well as at even shorter wavelengths. The 3000-K curve is quite a bit higher at the red end of the visible spectrum than at the violet end, so a dense object at this temperature will appear red in color. Similarly, the 12,000-K curve has its wavelength of maximum emission in the ultraviolet part of the spectrum, at a wavelength shorter than visible light. But such a hot, dense object also emits copious amounts of visible light (much more than at 6000 K or 3000 K, for which the curves are lower) and thus will have a very visible glow. The curve for this temperature is higher for blue light than for red light, and so the color of a dense object at 12,000 K is a brilliant blue or blue-white. These conclusions agree with the color changes of a heated rod shown in Figure 2-9. The same principles apply to stars: A star that looks blue has a high surface temperature, while a red star has a relatively cool surface.
Figure 2-11 shows the spectral curve for a temperature of 5800 K. It also shows the intensity curve for light from the Sun, as measured from above Earth’s atmosphere. (This is necessary because Earth’s atmosphere absorbs certain wavelengths.) The peak of both curves is at a wavelength of about 500 nm, near the middle of the visible spectrum. This is a strong indication that the temperature of the Sun’s glowing surface is about 5800 K—a temperature that we can measure across a distance of 150 million km! This is very valuable information for Earthbound astronomers trying to study the stars.
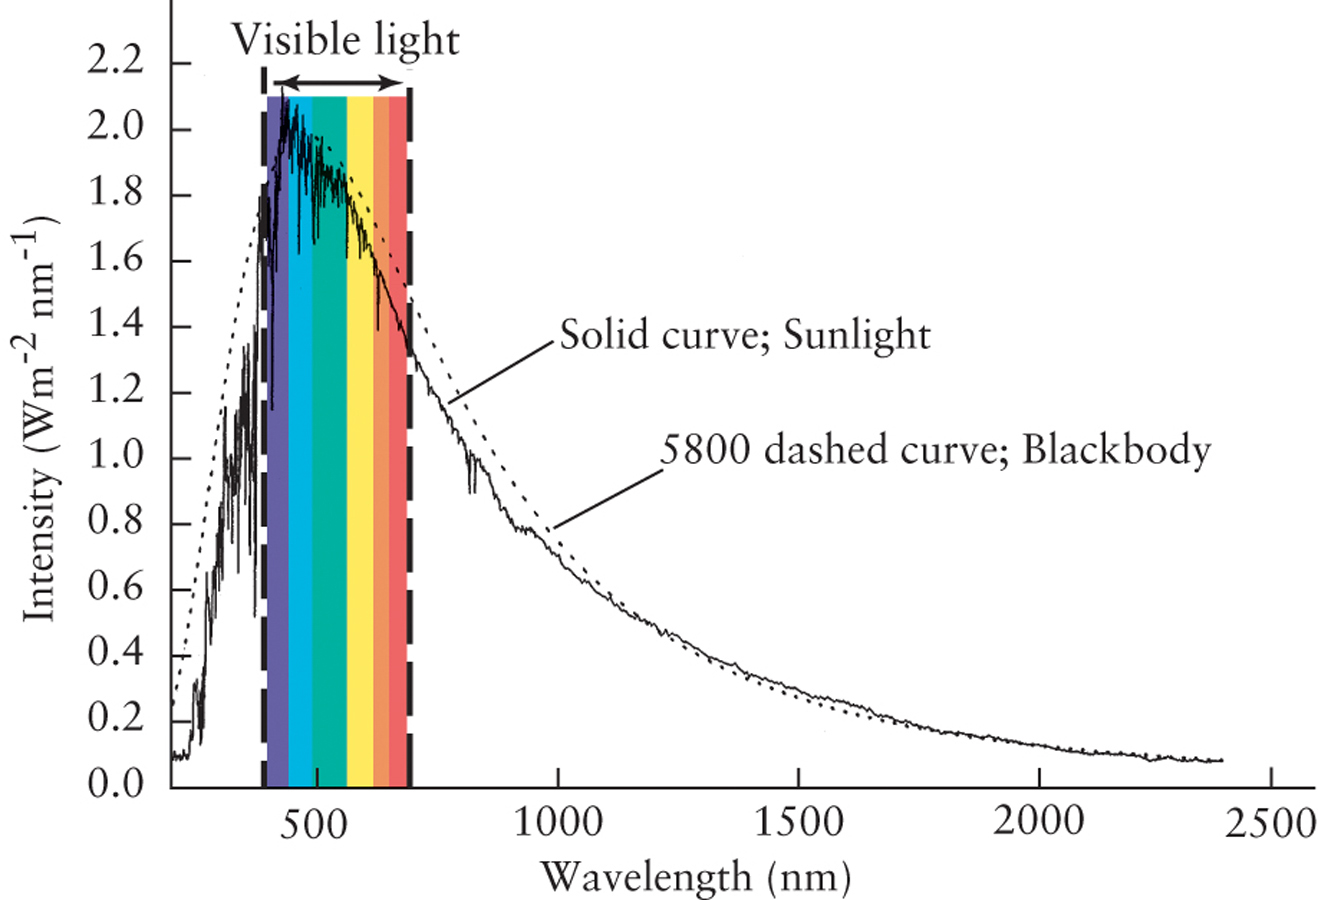
Wien’s law is very useful for determining the surface temperature of stars. It is not necessary to know how far away the star is, how large it is, or how much energy it radiates into space. All we need to know is the dominant wavelength of the star’s emitted light.
Question
ConceptCheck 2-7: What single piece of information do astronomers need to determine if a star is hotter than our Sun?
Question
CalculationCheck 2-2: Which wavelength of light would our Sun emit most if its temperature were twice its current temperature of 5800 K?
How Much Energy a Star Emits is Determined by Both Temperature and Surface Area
Several variables in addition to temperature are involved in determining how much energy an object emits. They include the object’s diameter, mass, and chemical composition. To understand how all these aspects work together, let us first consider how we measure energy. When we eat food to nourish our human bodies, we absorb energy. The amount of energy stored inside food is usually measured in calories in the United States. When we talk about stars, we more often use joules (J), named after the nineteenth-century English physicist James Joule. A joule is a standard unit for measuring energy and is equivalent to the kinetic energy of a 1-kg object moving at 1 m/s. The joule is a convenient unit of energy in astronomy because it is closely related to the more familiar watt (W): 1 W is 1 J/s2. For example, a 100-W lightbulb uses energy at a rate of 100 joules per second, or 100 J/s. As it turns out, the energy content of food can also often be measured in joules; in most of the world, diet soft drinks are labeled as “low joule” rather than “low calorie.”
43
The amount of the star’s total energy output, or its luminosity, depends both on its temperature and on its surface area. Just as a large burning log radiates much more heat than a burning match, even though the temperatures are the same, so do larger stars emit more energy than smaller stars, even at the same temperature. So, to understand how much energy a star emits, astronomers need to do more than measure temperature; they also need to consider the surface area of the star. This makes sense: To consider the effects of temperature alone, it is convenient to look at the amount of energy emitted from each square meter of an object’s surface in a second. This quantity is called the energy flux (F). Flux means “rate of flow,” and thus F is a measure of how rapidly energy is flowing out of the object.
Experimentally, the total amount of energy emitted from an object depends only on the temperature and its surface area. In fact, the energy flux from glowing objects is highly dependent on temperature—more so than anything else. Known as the Stefan-Boltzmann law, this idea can be represented using a simple mathematical relationship where the flux emitted by a star is proportional to the fourth power of the object’s temperature (measured in kelvins).
Stefan-Boltzmann law for a blackbody
The value of the constant σ (the Greek letter sigma) is known from laboratory experiments.
This relationship between temperature and flux emitted is incredibly powerful. If you double the temperature of an object (for example, from 300 K to 600 K), then the energy emitted from the object’s surface each second increases by a factor of 24 = 16. If you increase the temperature by a factor of 10 (for example, from 300 K to 3000 K), the rate of energy emission increases by a factor of 104 = 10,000. Thus, a chunk of iron at room temperature (around 300 K) emits very little energy at visible wavelengths, but an iron bar heated to 3000 K glows quite intensely. When astronomers apply the Stefan-Boltzmann law to stars, we are able to infer a star’s surface area, and thus its diameter. For example, there are some relatively cool stars that are intensely bright—the only way a cool star can be very bright is if these special stars themselves are gigantic, as deduced from these principles. As another example, we find some amazingly hot stars that are quite dim; again, the only way this can be is if the star itself is quite small. Box 2-2 Tools of the Astronomer’s Trade: Using the Laws of Black-body Radiation gives several examples of applying Wien’s law and the Stefan-Boltzmann law to typical astronomical problems.
Question
ConceptCheck 2-8: If you observe a red star and a blue star in the sky, how do you distinguish which star is at a higher temperature?
Question
CalculationCheck 2-3: How many times more energy flux comes from a star that is 3 times hotter than the Sun?
Light Has Properties of Both Waves and Particles
To round out our understanding of why this works the way it does, we need to realize that the famous German-born physicist Albert Einstein had a great influence on our modern thinking about light. In 1905, Einstein realized that light beams are not continuous; rather, they come in discrete, particlelike packets known as light quanta (the plural of quantum, from a Latin word meaning “how much”). Further, Einstein proposed that the energy of each light quantum—today we usually call it a photon—is related to the wavelength of light: The greater the wavelength, the lower the energy of a photon associated with that wavelength. For example, a photon of red light (λ = 700 nm) has less energy than a photon of violet light (λ = 400 nm). In this picture, light has a dual personality; it behaves as a stream of particlelike photons, but each photon has wavelike properties. In this sense, the best answer to the question “Is light a wave or a stream of particles?” is “Yes!”
Imagining light photons as being both a particle and a wave explains a lot. For example, the photon view of light explains why only ultraviolet light causes suntans and sunburns. The reason is that tanning or burning involves a chemical reaction in the skin. High-energy, short-wavelength ultraviolet photons can trigger these reactions, but the lower-energy, longer-wavelength photons of visible light cannot. Similarly, normal photographic film is sensitive to visible light but not to infrared light; a long-wavelength infrared photon does not have enough energy to cause the chemical change that occurs when film is exposed to the higher-energy photons of visible light. To commemorate this great achievement, Einstein and other scientists working on he photon nature of light won Nobel Prizes for their contributions to understanding the nature of light.
44
TOOLS OF THE ASTRONOMER’S TRADE
Using the Laws of Blackbody Radiation
The Sun and stars behave like nearly perfect blackbodies. Wien’s law and the Stefan-Boltzmann law can therefore be used to relate the surface temperature of the Sun or a distant star to the energy flux and wavelength of maximum emission of its radiation. The following examples show how to do this.
EXAMPLE: The maximum intensity of sunlight is at a wavelength of roughly 500 nm = 5.0 × 10⁻⁷ m. Use this information to determine the surface temperature of the Sun.
Situation: We are given the Sun’s wavelength of maximum emission λmax, and our goal is to find the Sun’s surface temperature, denoted by T⊙. (The symbol ⊙ is the standard astronomical symbol for the Sun.)
Tools: We use Wien’s law to relate the values of λmax and T⊙.
Answer: As written, Wien’s law tells how to find λmax if we know the surface temperature. To find the surface temperature from λmax, we first rearrange the formula, then substitute the value of λmax:
Review: This is a very high temperature by Earth standards, about the same as an iron welding arc.
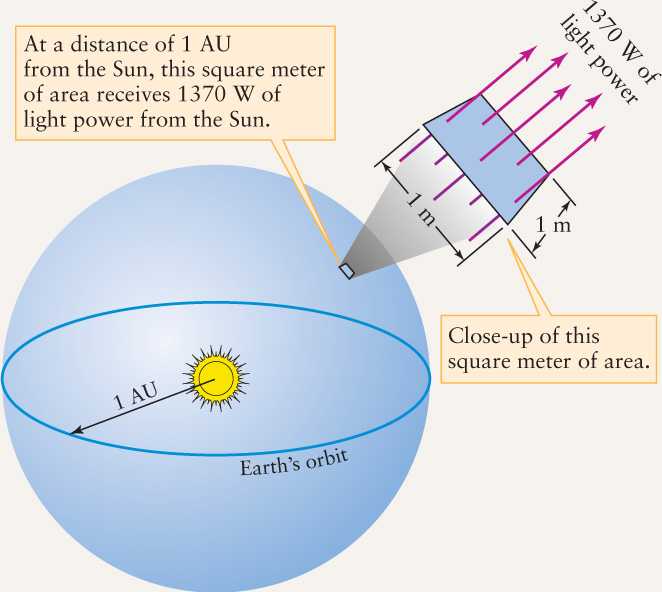
EXAMPLE: Using detectors above Earth’s atmosphere, astronomers have measured the average flux of solar energy arriving at Earth. This value, called the solar constant, is equal to 1370 W m−2. Use this information to calculate the Sun’s surface temperature. (This provides a check on our result from the preceding example.)
Situation: The solar constant is the flux of sunlight as measured at Earth. We want to use the value of the solar constant to calculate T⊙.
Tools: It may seem that all we need is the Stefan-Boltzmann law, which relates flux to surface temperature. However, the quantity F in this law refers to the flux measured at the Sun’s surface, not at Earth. Hence, we will first need to calculate F from the given information.
Answer: To determine the value of F, we first imagine a huge sphere of radius 1 AU with the Sun at its center, as shown in the figure. Each square meter of that sphere receives 1370 W of power from the Sun, so the total energy radiated by the Sun per second is equal to the solar constant multiplied by the sphere’s surface area. The result, called the luminosity of the Sun and denoted by the symbol L⊙, is 3.90 × 1026 W. That is, in 1 s the Sun radiates 3.90 × 1026 J of energy into space. Because we know the size of the Sun, we can compute the energy flux (energy emitted per square meter per second) at its surface. The radius of the Sun (R⊙) is 6.96 × 10⁸ m, and the Sun’s surface area is 4πR⊙2. Therefore, its energy flux (F⊙) is the Sun’s luminosity (total energy emitted by the Sun per second) divided by the Sun’s surface area (the number of square meters of surface):
Once we have the Sun’s energy flux F⊙, we can use the Stefan-Boltzmann law to find the Sun’s surface temperature T⊙:
Taking the fourth root (the square root of the square root) of this value, we find the surface temperature of the Sun to be 5800 K.
Review: Our result for T⊙ agrees with the value we computed in the previous example using Wien’s law. Notice that the solar constant of 1370 W m−2 is very much less than F⊙, the flux at the Sun’s surface. By the time the Sun’s light reaches Earth, it is spread over a greatly increased area.
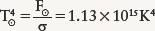
EXAMPLE: Sirius, the brightest star in the night sky, has a surface temperature of about 10,000 K. Find the wavelength at which Sirius emits most intensely.
Situation: Our goal is to calculate the wavelength of maximum emission of Sirius (λmax) from its surface temperature T.
Tools: We use Wien’s law to relate the values of λmax and T.
Answer: Using Wien’s law,

Review: Our result shows that Sirius emits light most intensely in the ultraviolet. In the visible part of the spectrum, it emits more blue light than red light (like the curve for 12,000 K in Figure 2-10), so Sirius has a distinct blue color.
EXAMPLE: How does the energy flux from Sirius compare to the Sun’s energy flux?
Situation: To compare the energy fluxes from the two stars, we want to find the ratio of the flux from Sirius to the flux from the Sun.
Tools: We use the Stefan-Boltzmann law to find the flux from Sirius and from the Sun, which from the preceding examples have surface temperatures 10,000 K and 5800 K, respectively.
Answer: For the Sun, the Stefan-Boltzmann law is  , and for Sirius we can likewise write
  , where the subscripts ⊙ and * refer to the Sun and Sirius, respectively. If we divide one equation by the other to find the ratio of fluxes, the Stefan-Boltzmann constants cancel out and we get
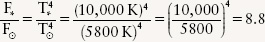
Review: Because Sirius has such a high surface temperature, each square meter of its surface emits 8.8 times more energy per second than a square meter of the Sun’s relatively cool surface. Sirius is actually a larger star than the Sun, so it has more square meters of surface area and hence its total energy output is more than 8.8 times that of the Sun.
Question
ConceptCheck 2-9: If a photon’s wavelength is measured to be longer than the wavelength of a green photon, will it have a greater or lower energy than a green photon?