9-4 Sunspots are low-temperature regions in the photosphere
One might think that the Sun shines pretty much the same, day in and day out. Granules, spicules, and the solar wind occur continuously, and these features are often considered to be aspects of the quiet Sun. But, as it turns out, other, more dramatic features appear periodically, including massive eruptions and regions of concentrated magnetic fields. When these are present, astronomers refer to the active Sun. The features of the active Sun that can most easily be seen with even a small telescope—although only with an appropriate filter attached—are sunspots.
Observing Sunspots
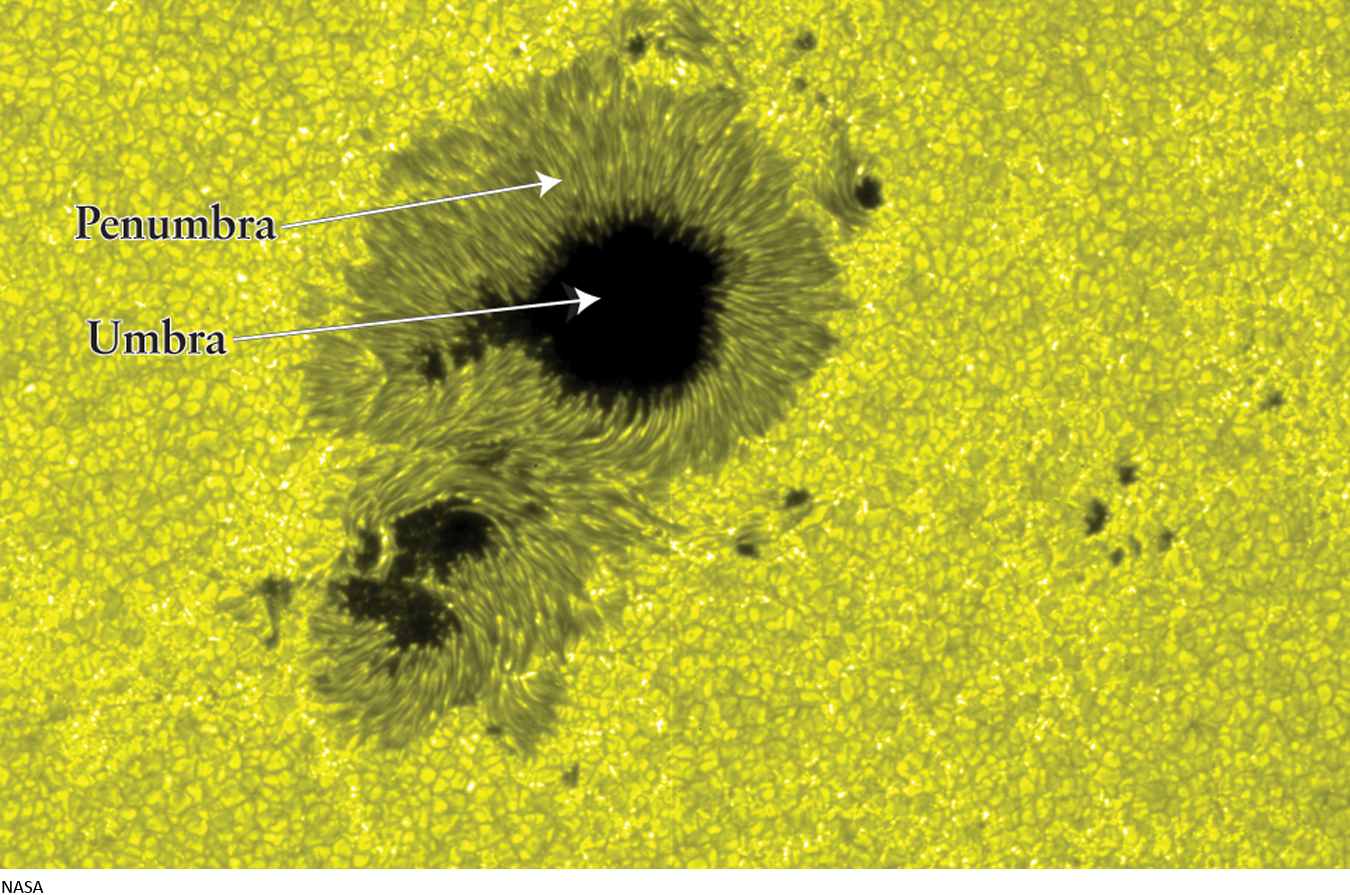
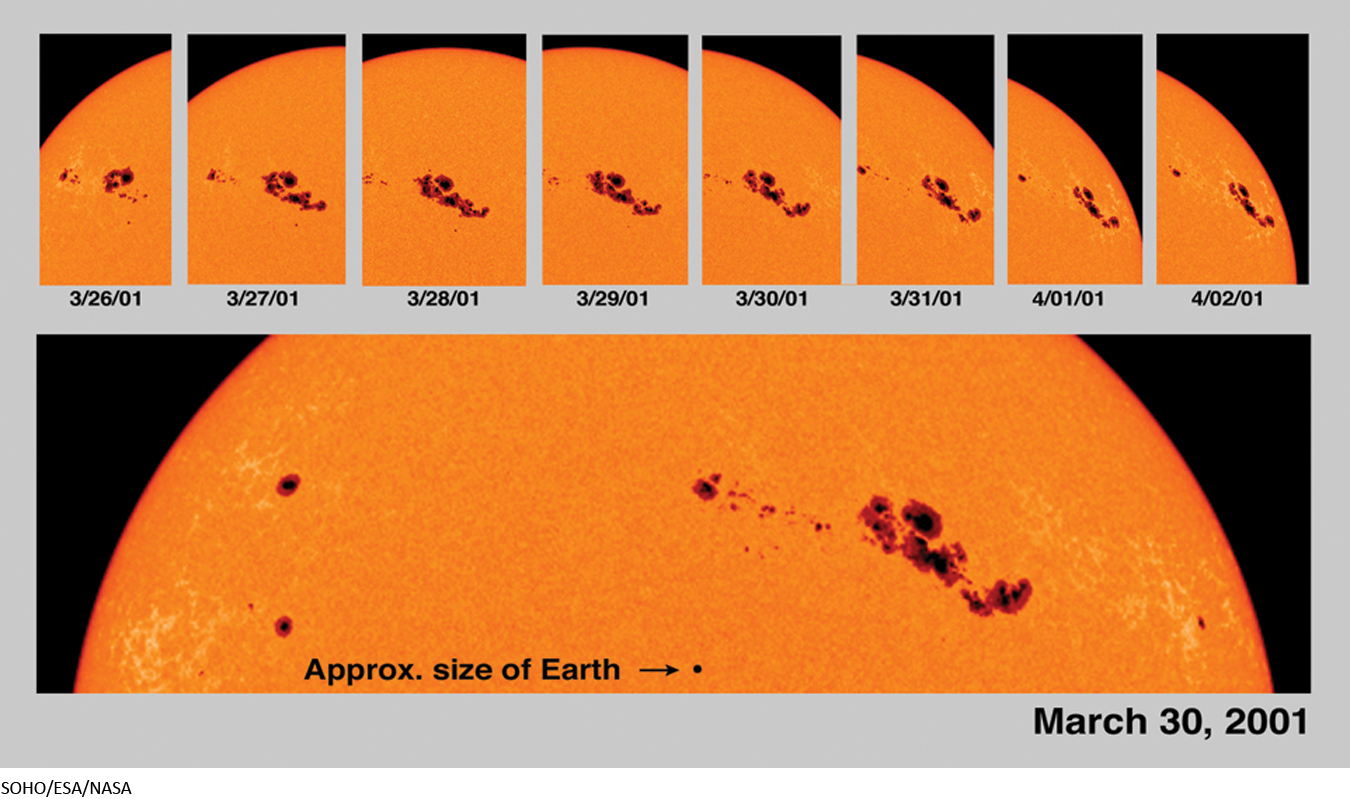
Sunspots are irregularly shaped dark regions in the photosphere. Sometimes sunspots appear in isolation (Figure 9-13), but frequently they are found in sunspot groups. Although sunspots vary greatly in size, typical ones measure a few tens of thousands of miles across—comparable to the diameter of planet Earth. Sunspots are not permanent features of the photosphere but last between a few hours and a few months.
217
Each sunspot has a dark central core, called the umbra, and a brighter border called the penumbra. A sunspot is a region in the photosphere where the temperature is relatively low, which makes it appear darker than its surroundings. The colors of a sunspot indicate that the temperature of the umbra is typically 7000°F (4300 K), whereas that of the penumbra is typically 8500°F (5000 K). While high by earthly standards, these temperatures are quite a bit lower than the average temperature of the photosphere of 10,000°F (5800 K). The lower temperature of sunspots explains why these regions appear so dark—they simply emit less light because they are at a cooler temperature.
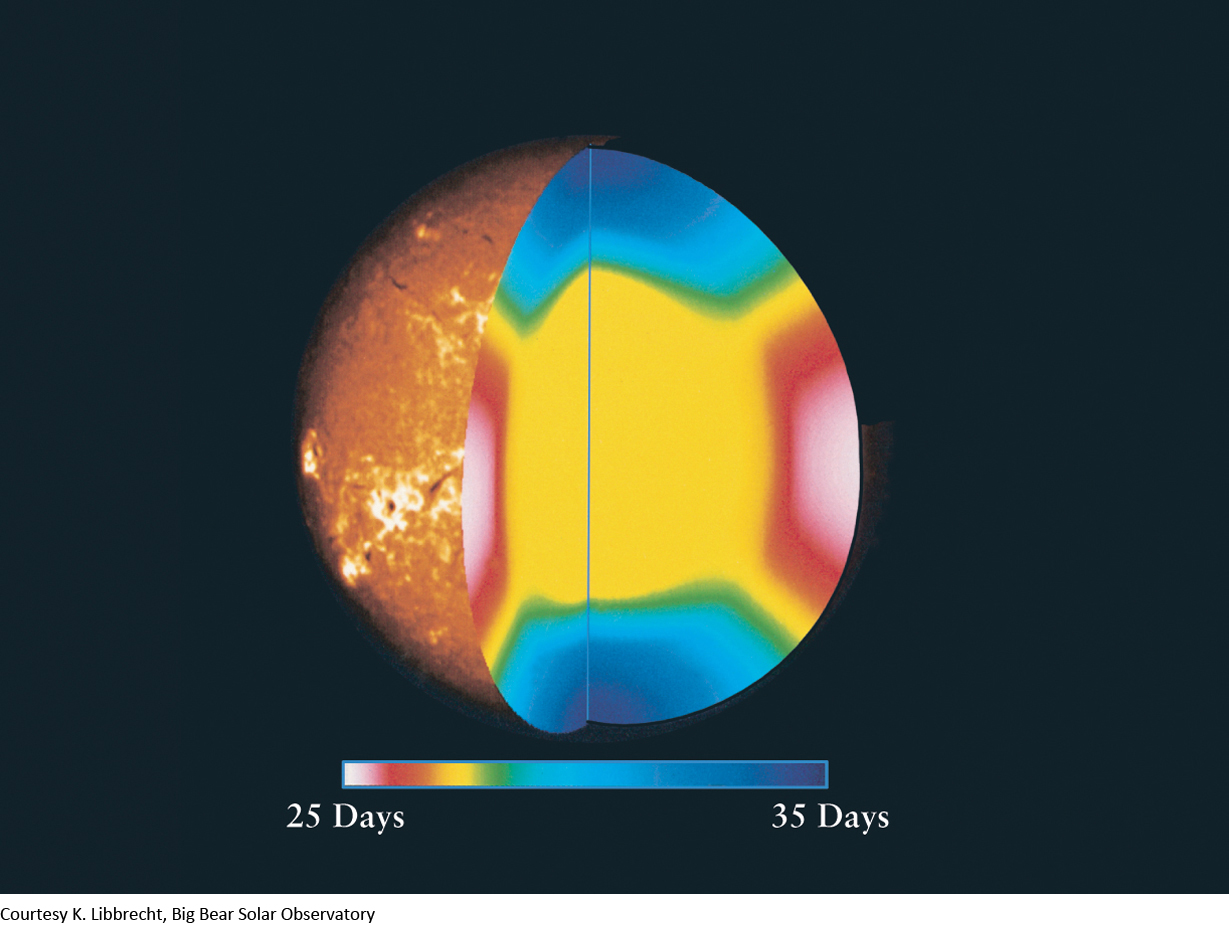
Occasionally, a sunspot group is large enough to be seen without a telescope. Chinese astronomers recorded such sightings 2000 years ago, and huge sunspot groups visible to the naked eye (with an appropriate filter) were seen in 1989 and 2003. But it was not until Galileo introduced the telescope into astronomy that anyone was able to examine how sunspots move in detail. Galileo discovered that he could determine the Sun’s rotation rate by tracking sunspots as they moved across the Sun’s face (Figure 9-14). He found that the Sun rotates once in about four weeks. A typical sunspot group lasts about two months, so a specific one can be followed for two solar rotations. After more careful study of sunspot movements, it was determined that the equatorial regions rotate more rapidly than the polar regions. This phenomenon is known as differential rotation. Thus, while a sunspot near the solar equator takes only 25 days to go once around the Sun, a sunspot at 30° north or south of the equator takes 27½ days. The rotation period at 75° north or south is about 33 days, while near the poles it may be as long as 35 days.
Question
ConceptCheck 9-14: If the center of a sunspot has a temperature of about 7000°F (4300 K), why does it appear dark?
The Sunspot Cycle
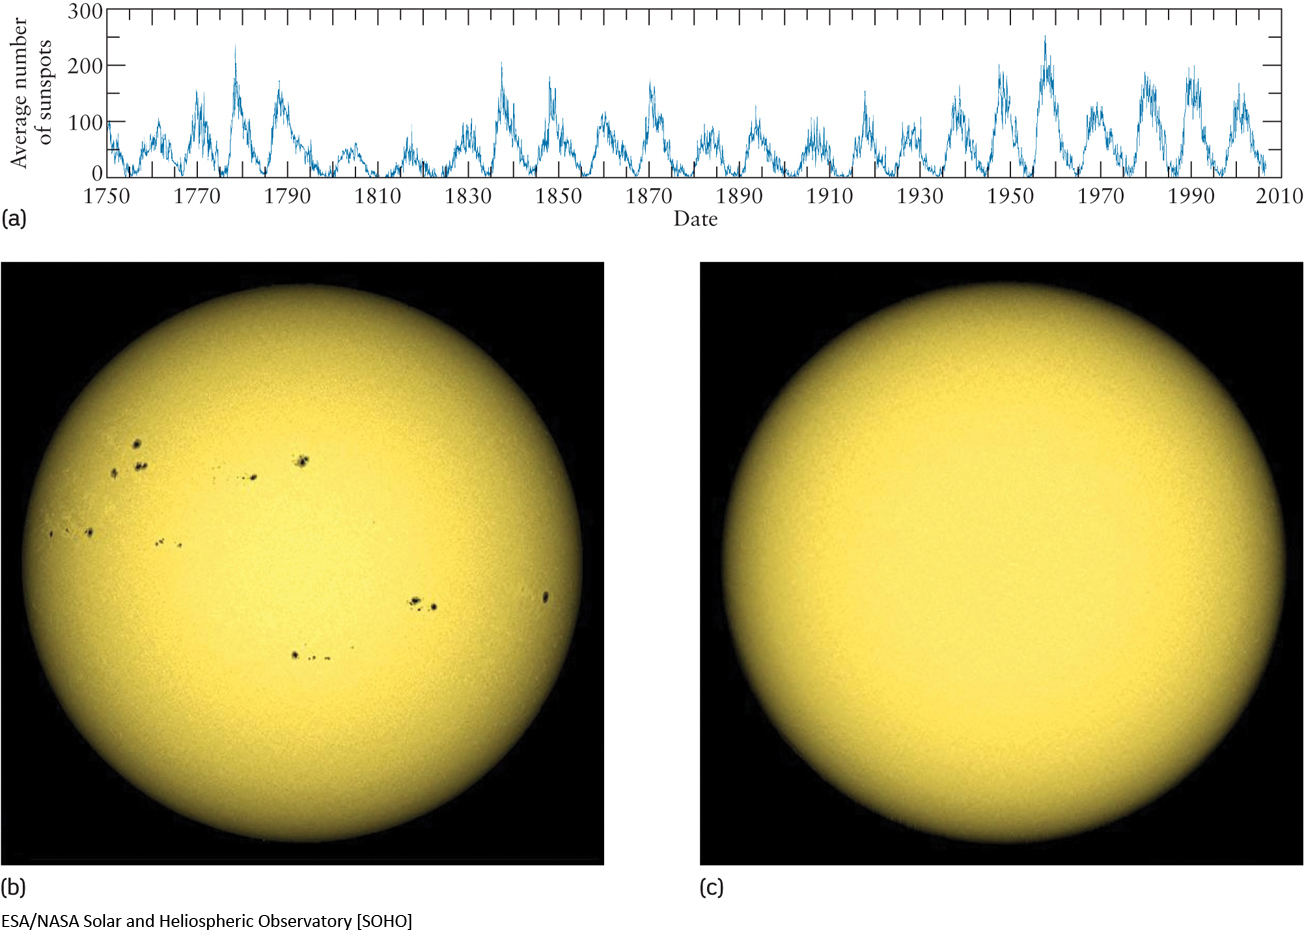
Sun observers have been carefully monitoring the Sun’s activity since the introduction of the telescope. What is readily observed when looking over sunspot records is that the average number of sunspots on the Sun is not constant, but varies in a predictable sunspot cycle (Figure 9-15). As Figure 9-15a shows, the average number of sunspots varies with a period of about 11 years. A period of exceptionally many sunspots is a sunspot maximum (Figure 9-15b), as occurred in 1989, 2000, and 2011, and is projected to occur in 2022. Conversely, the Sun is almost devoid of sunspots at a sunspot minimum (Figure 9-15c), as occurred in 1986, 1996, 2008, and 2016.
Why should the number of sunspots vary with an 11-year cycle? Why should their average latitude vary over the course of a cycle? And why should sunspots exist at all? The first step toward answering these questions came in 1908, when the American astronomer George Ellery Hale discovered that sunspots are associated with intense magnetic fields on the Sun.
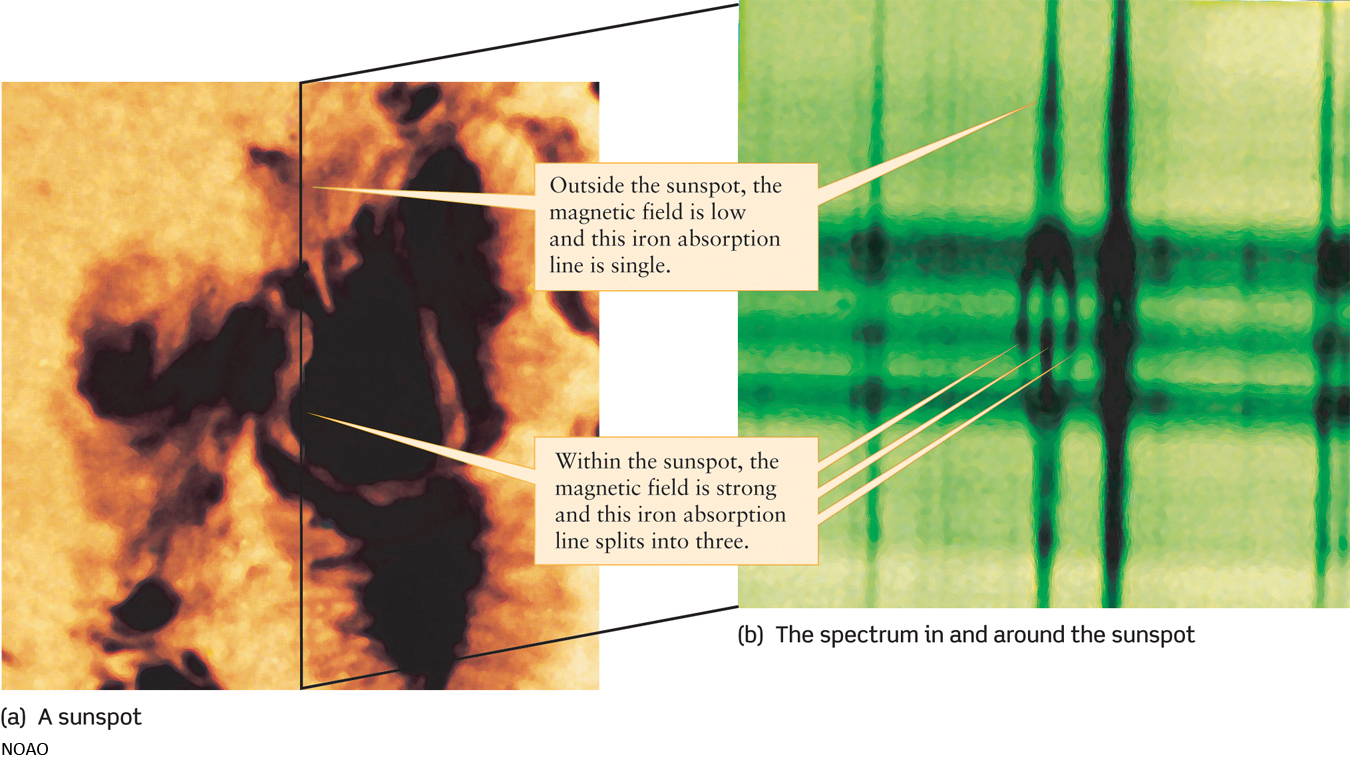
When Hale focused a spectroscope on sunlight coming from a sunspot, he found that many spectral lines appear to be split into several closely spaced lines (Figure 9-17). This “splitting” of spectral lines is called the Zeeman effect, after the Dutch physicist Pieter Zeeman, who first observed it in his laboratory in 1896. Zeeman showed that a spectral line splits when the atoms are subjected to an intense magnetic field. Astronomers can infer the strength of the magnetic field because the more intense the magnetic field, the wider the separation of the split lines.
218
Intense magnetic fields have a dramatic effect on how material moves around the Sun. Many of the atoms in the Sun’s atmosphere are ionized due to the high temperature, and ionized material is particularly influenced by strong magnetic fields. The solar atmosphere is thus composed of a special type of gas called a plasma, in which electrically charged ions and electrons can move freely. As it turns out, sunspots are places where the Sun’s plasma is bathed in a concentrated magnetic field that causes the plasma near sunspots to move in predictable ways.
Magnetic forces act on hot plasma rising from the Sun’s interior due to convection. Where the magnetic field is particularly strong, these forces push the hot plasma away. The result is a localized region where the gas is relatively cool and thus glows less brightly—in other words, it creates a sunspot. By carefully measuring the magnetic fields around a sunspot group, we discover that a group resembles a giant bar magnet, with a north magnetic pole at one end and a south magnetic pole at the other.
219
If different sunspot groups were unrelated to one another, their magnetic poles would be randomly oriented, like a bunch of compass needles all pointing in random directions. However, there is a striking regularity in the magnetization of sunspot groups. As a given sunspot group moves with the Sun’s rotation, the sunspots in front are called the “preceding members” of the group. The spots that follow behind are referred to as the “following members.” When you compare sunspot groups in the two solar hemispheres, north or south of the Sun’s equator, the preceding members in one solar hemisphere all have the same magnetic polarity, while the preceding members in the other hemisphere have the opposite polarity. Furthermore, in the hemisphere where the Sun has its north magnetic pole, the preceding members of all sunspot groups have north magnetic polarity. In the opposite hemisphere, where the Sun has its south magnetic pole, the preceding members all have south magnetic polarity.
To complicate matters further, it turns out that the Sun’s polarity pattern completely reverses itself every 11 years—the same interval as the time from one solar maximum to the next. The hemisphere that has preceding north magnetic poles during one 11-year sunspot cycle will have preceding south magnetic poles during the next 11-year cycle, and vice versa. The north and south magnetic poles of the Sun itself also reverse every 11 years. Thus, the Sun’s magnetic pattern repeats itself only after two sunspot cycles, which is why astronomers speak of a 22-year solar cycle.
Question
ConceptCheck 9-15: Is the sunspot cycle an 11-year cycle or a 22-year cycle?
The Magnetic-Dynamo Model
In 1960, the American astronomer Horace Babcock proposed a description that seems to account for many features of this 22-year solar cycle. Babcock’s scenario, called a magnetic-dynamo model, makes use of two basic properties of the Sun’s photosphere—differential rotation and convection. Differential rotation causes the magnetic field in the photosphere to become wrapped around the Sun (Figure 9-18). As a result, the magnetic field becomes concentrated at certain latitudes on either side of the solar equator. Convection in the photosphere creates tangles in the concentrated magnetic field, and “kinks” erupt through the solar surface. Sunspots appear where the magnetic field protrudes through the photosphere. The theory suggests that sunspots should appear first at northern and southern latitudes and later form nearer to the equator. This is just what is observed (see Figure 9-16). Note also that, as shown on the far right in Figure 9-18, the preceding member of a sunspot group has the same polarity (N or S) as the Sun’s magnetic pole in that hemisphere.
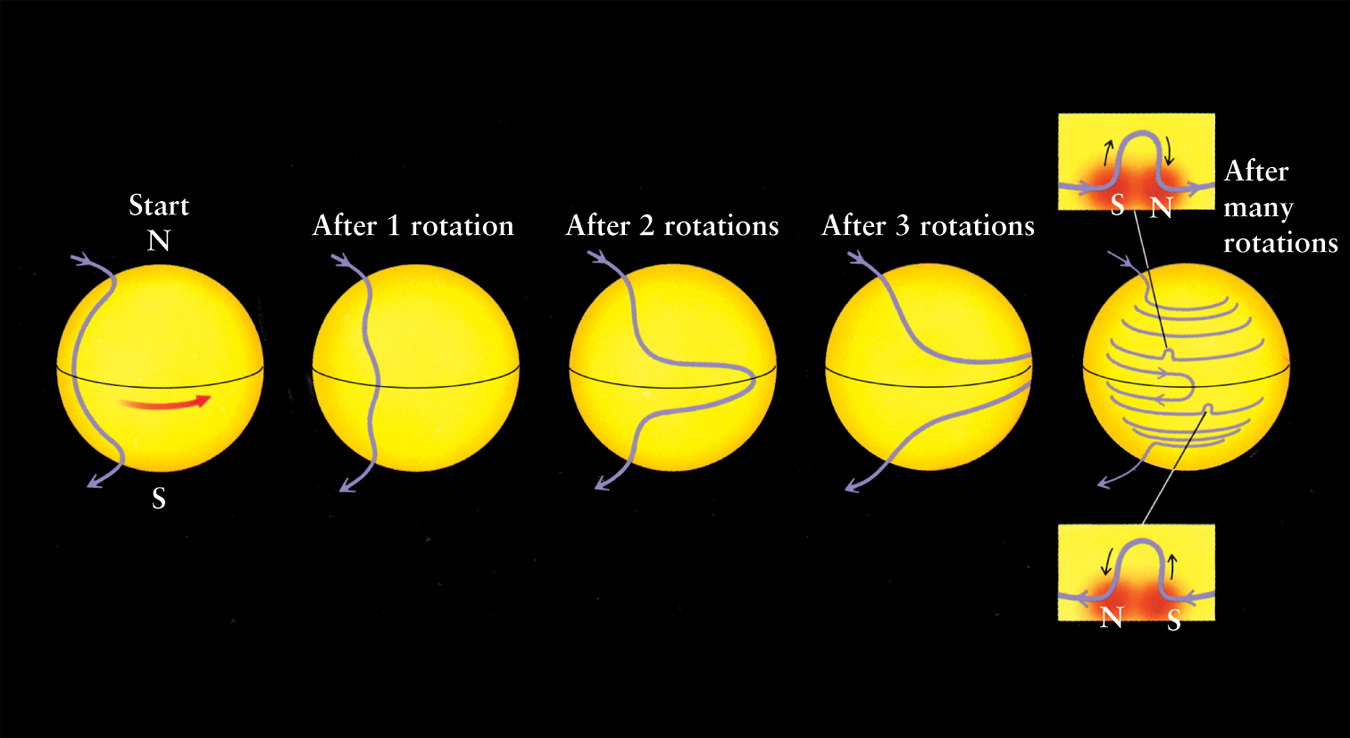
Differential rotation eventually undoes the twisted magnetic field. The preceding members of sunspot groups move toward the Sun’s equator, while the following members migrate toward the poles. Because the preceding members from the two hemispheres have opposite magnetic polarities, their magnetic fields cancel each other out when they meet at the equator. The following members in each hemisphere have the opposite polarity to the Sun’s pole in that hemisphere; hence, when they converge on the pole, the following members first cancel out and then reverse the Sun’s overall magnetic field. The fields are now completely relaxed. Once again, differential rotation begins to twist the Sun’s magnetic field, but now with all magnetic polarities reversed. In this way, Babcock’s model helps to explain the change in field direction every 11 years.
220
By comparing the speeds of sound waves that travel with and against the Sun’s rotation, astronomers now understand that the Sun’s rotation rate is different at different depths and latitudes. As shown in Figure 9-19, the Sun’s surface pattern of differential rotation persists through the convective zone. Farther in, within the radiative zone, the Sun seems to rotate like a rigid object with a period of 27 days at all latitudes. Astronomers suspect that the Sun’s magnetic field originates in a relatively thin layer where the radiative and convective zones meet and slide past each other due to their different rotation rates.
Adding to the yet-to-be-fully-understood nature of the Sun, there seem to be times when all traces of sunspots and the sunspot cycle vanish for many years. For example, virtually no sunspots were seen from 1645 through 1715. Curiously, during these same years Europe experienced record low temperatures, often referred to as the Little Ice Age, whereas the western United States was subjected to severe drought. By contrast, there was apparently a period of increased sunspot activity during the eleventh and twelfth centuries, during which Earth was warmer than it is today. Thus, variations in solar activity appear to affect climates on Earth. The origin of this Sun-Earth connection is a topic of ongoing research.
Question
ConceptCheck 9-16: How might the Sun’s sunspot cycle change if the Sun were rotating much faster than it is now?