EXAMPLE 2Graphing a Vector Function
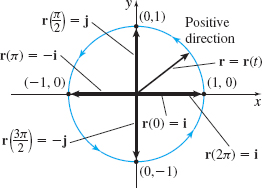
Figure 4 r(t)=costi+sintj, 0≤t≤2π
Discuss the graph of the vector function \[ \begin{equation*} \mathbf{r}(t)=\cos t\mathbf{i}+\sin t\mathbf{j}\qquad 0\leq t\leq 2\pi \end{equation*}
Solution The components of r=r(t) are the parametric equations x=x(t)=costy=y(t)=sint0≤t≤2π
Since x2+y2=cos2t+sin2t=1, the vector function r=r(t) traces out a circle with its center at the origin and radius 1. See Figure 4. The curve begins at r(0)=cos0i+sin0j=i, contains the vectors r(π2)=cosπ2i+sinπ2j=j, r(π)=cosπi+sinπj=−i, and r(3π2)=−j. It ends at r(2π)=i, so the positive direction of the circle is counterclockwise.