EXAMPLE 6Graphing Level Curves
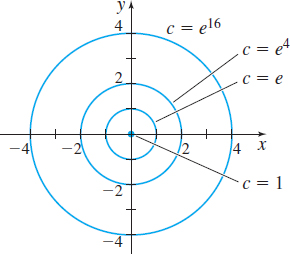
Graph the level curves of the function z=f(x,y)=ex2+y2 for c=1,e,e4, and e16.
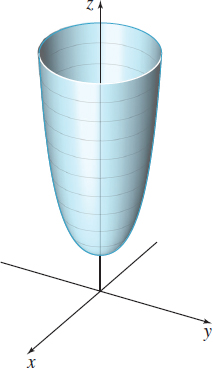
Solution Because x2+y2≥0, it follows that z≥e0=1. The level curves satisfy the equation ex2+y2=c or x2+y2=lnc,where c≥1. For c=1, the level curve is the point (0,0). If c>1, the level curves are concentric circles. Figure 14 illustrates several level curves of f. A graph of the surface z=ex2+y2 is given in Figure 15. Do you see how the graph evolved from the collection of its level curves?

