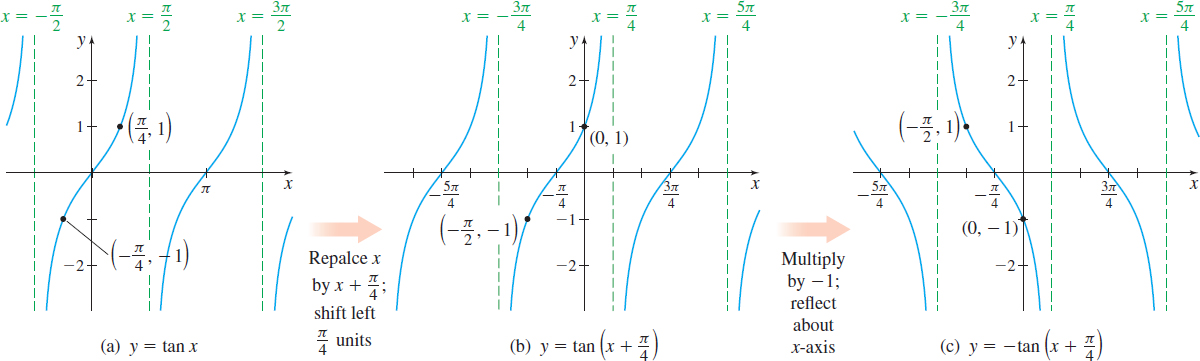
EXAMPLE 4Graphing Variations of f(x)=tanx Using Transformations
Use the graph of f(x)=tanx to graph g(x)=−tan(x+π4).
Solution Figure 78 illustrates the steps used in graphing g(x)=−tan(x+π4).
Use the graph of f(x)=tanx to graph g(x)=−tan(x+π4).
Solution Figure 78 illustrates the steps used in graphing g(x)=−tan(x+π4).